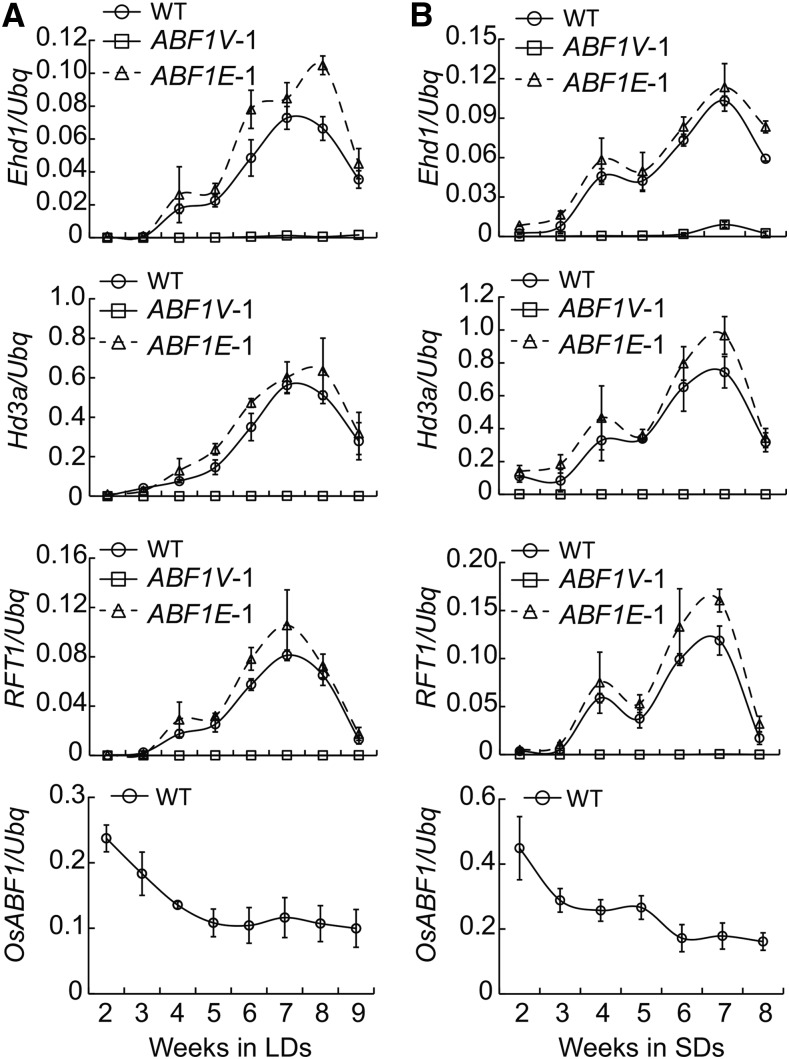
Figure 3.
Transcriptional levels of indicated flowering-associated genes in each genotype at different developmental stages. A, Plants were grown in LDs. Samples were the latest fully expended leaves that were collected just at the end of dark period. Three biological replicates of qRT-PCR experiment were performed using Ubq gene as the internal control and the representative results were shown. Values were shown as mean ± sd (n = 3). B, Plants were grown in SDs and qRT-PCR experiments were performed as in A.

