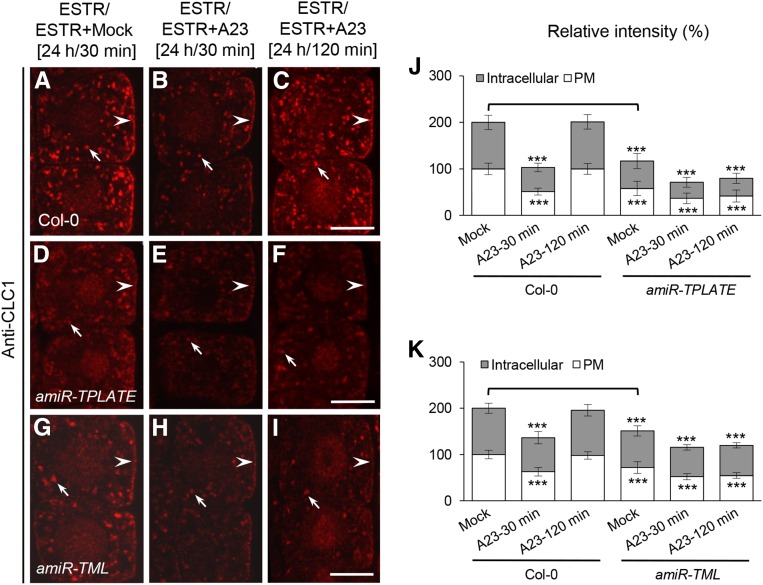
Figure 9.
TPC-dependent membrane association of clathrin in AP-2-deficient cells. A to I, Effects of the down-regulation of TPLATE and TML on the membrane association of CLC1 in TyrA23-treated root cells. J and K, Relative intensities of CLC1 at the PM and intracellular compartments in amiR-TPLATE (J; n = 47–67 cells from eight to 11 roots each) and amiR-TML (K; n = 45–59 cells from six to eight roots each) lines upon TyrA23 treatment. Durations of induction with ESTR (5 μm) and treatments with DMSO (Mock) and TyrA23 (A23; 30 μm) are indicated at the top. Arrowheads and arrows show PM- and intracellular compartment-associated CLC1, respectively. Values shown are means ± sd. ***, P < 0.0001 (Student’s t test; TyrA23 treatments versus their own mock control; the mock control in amiR-TPLATE and amiR-TML lines versus the wild-type mock control is indicated by brackets). Bars = 7.5 μm.

