Figure 1.
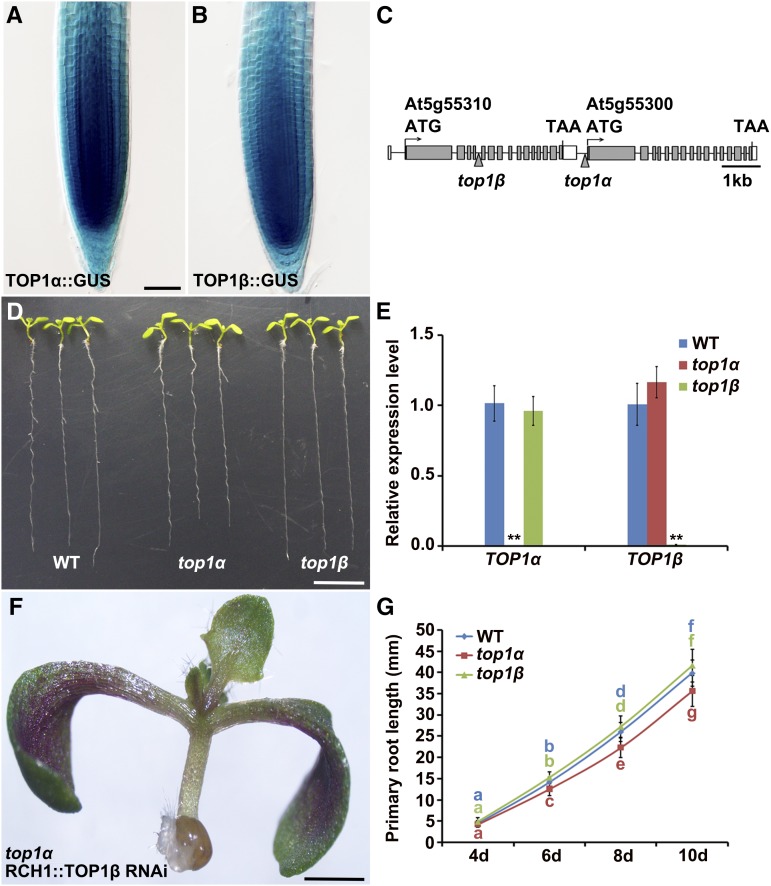
Both TOP1α and TOP1β are transcribed in the root meristem, but only TOP1α displays specific functions in root development. A and B, Expression (stained in blue) of TOP1α::GUS (A) and TOP1β::GUS (B) in wild-type root tips. Bar = 50 μm. C, A schematic diagram showing tandemly arrayed TOP1α and TOP1β genomic regions. Gray and white boxes represent exons and 3′-untranslated regions, respectively, and horizontal lines indicate introns and 5′-untranslated regions. Arrowheads point to the T-DNA insertion sites in top1α and top1β. ATG, Transcription start site; TAA, stop codon. D, Phenotypes of 10-d-old wild-type, top1α, and top1β seedlings. Bar = 1 cm. E, qRT-PCR analysis of TOP1α and TOP1β transcription in roots of wild-type, top1α, and top1β seedlings. Transcript levels of TOP1α and TOP1β in wild-type roots were set to 1. Error bars represent sd from three independent experiments. **P < 0.01, t test. F, A top1α seedling carrying the RCH1::TOP1β RNAi transgene. Bar = 1 cm. G, Time-course analysis of root lengths of wild-type, top1α, and top1β seedlings. Measurements were performed on the indicated days. Error bars represent sd (n > 20). Bars with different letters are significantly different at P < 0.01, t test.

