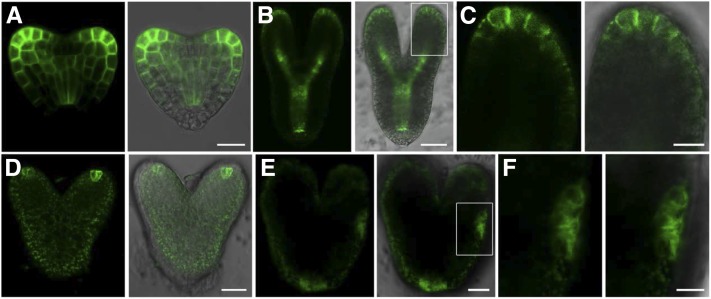
Figure 7.
Expression of PIN1-GFP during embryogenesis. A and B, PIN1-GFP distribution in wild-type embryos at the heart stage (A) and the torpedo stage (B). C, Higher magnification image of the boxed region in B. D and E, PIN1-GFP distribution in embryos dissected from smo2-1/+ smo2-2 siliques at the heart stage (D) and the late heart-like stage (E). F, Higher magnification image of the boxed region in E. Bars = 10 μm (A, C, and F) and 25 μm (B, D, and E).

