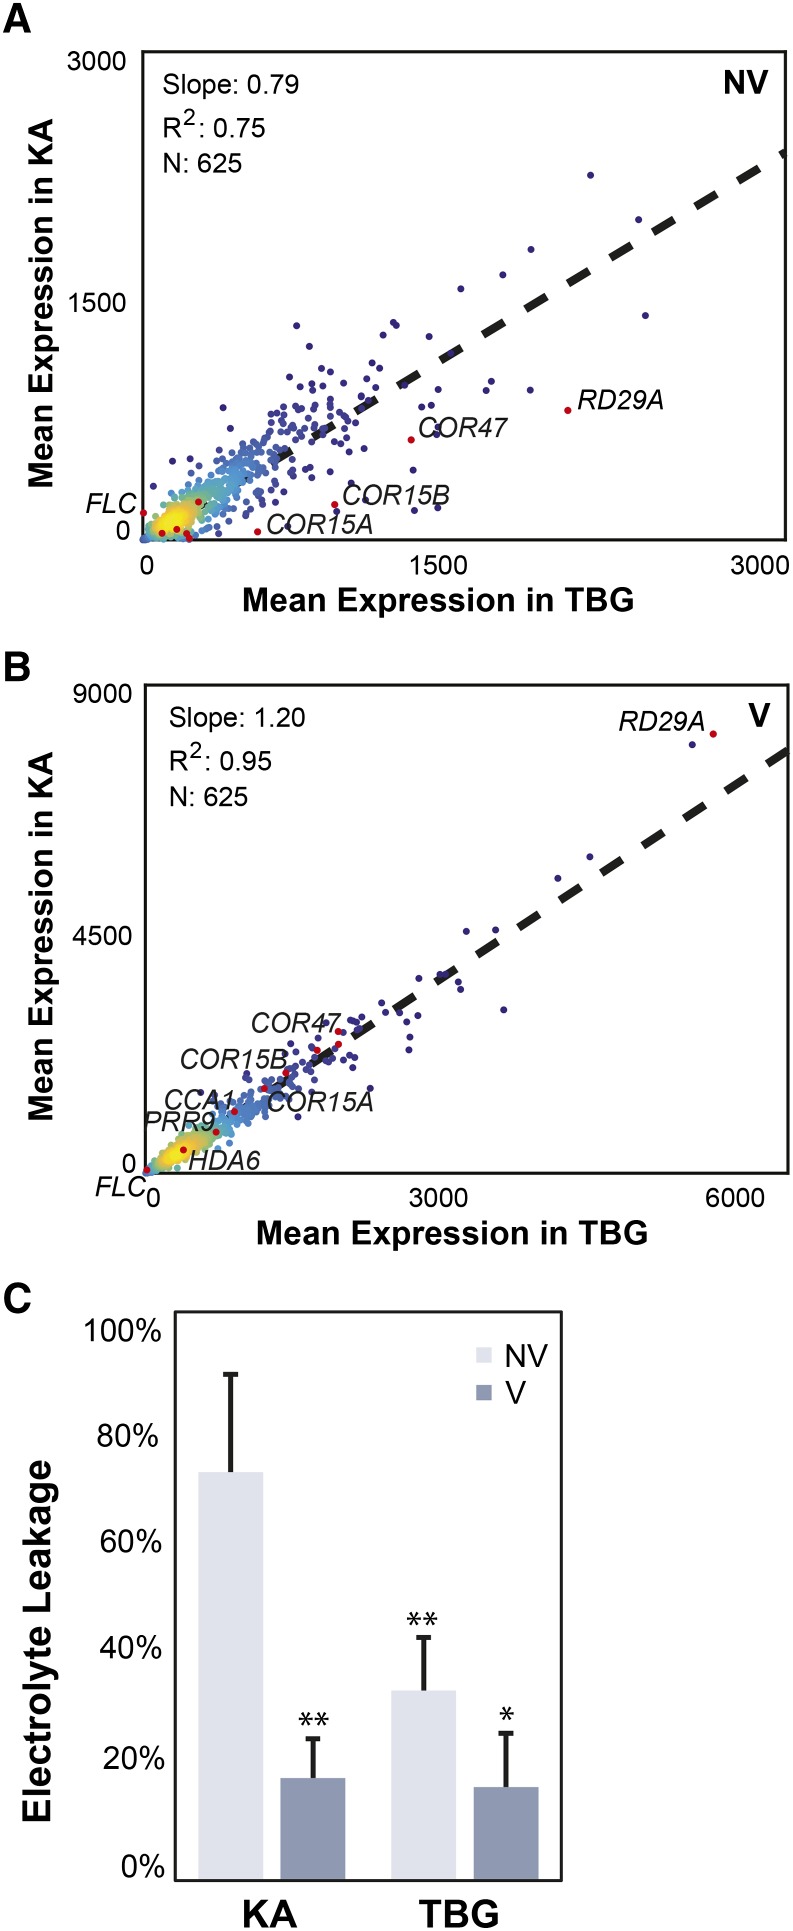
Figure 4.
Expression of vernalization-responsive genes in KA versus TBG. A, Expression levels of vernalization-responsive genes in unvernalized KA plotted against their levels in unvernalized TBG. The slope of the linear regression (0.79 with r2 = 0.75) indicates that vernalization-responsive genes have a higher expression in TBG in unvernalized plants. Known cold-responsive genes are highlighted in red, and in particular, COR15A, COR15B, COR47, and RD29A show even stronger bias toward higher constitutive expression in TBG. B, Expression levels of vernalization-responsive genes in vernalized KA versus vernalized TBG. Due to the stronger vernalization response in KA, the relationship is inversed compared with A (slope of 1.2 with r2 = 0.95). C, Electrolyte leakage measured after freezing at −6°C of leaves from 7-week-old KA and TBG plants vernalized for 1 week (V; dark blue bars) or not vernalized (NV; light blue bars). Two asterisks indicate significant differences of vernalized KA and nonvernalized TBG compared with the high leakage of unvernalized KA plants (Student’s t test P < 1%). One asterisk denotes a significant difference of vernalized TBG from the controlled leakage of unvernalized TBG (Student’s t test P < 5%).

