Figure 8.
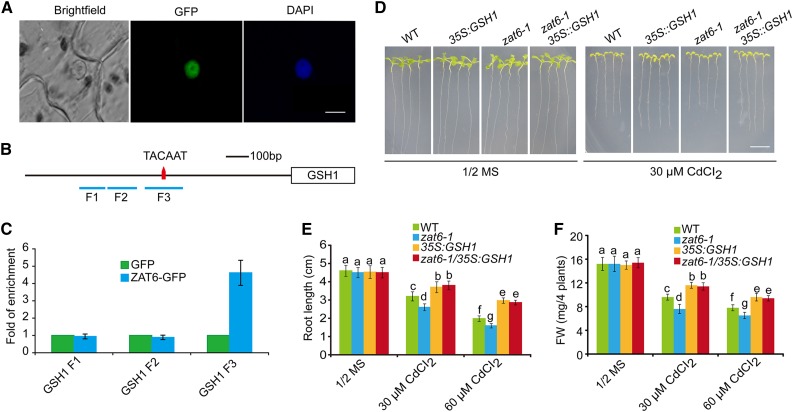
ZAT6 directly binds to the promoter region of GSH1. A, Nuclear localization of ZAT6-GFP in epidermal cells. Bar = 5 μm. B, Schematic diagram of the promoter region of GSH1. Red triangle represents the locus of TACAAT box. Blue lines, including F1, F2, and F3, show the region of ChIP-qPCR primer pairs. C, Quantitative real-time PCR assay of DNA after ChIP. Input DNAs were used as internal control. D, GSH1 overexpression restores the Cd-hypersensitive phenotype in zat6-1 mutant. Three-day-old wild-type, zat6-1, 35S::GSH1, and zat6-1/35S::GSH1 seedlings grown on 1/2 MS medium were transferred to 1/2 MS medium without or with 30 μm CdCl2. Photographs were taken 11 d after transfer. Bar = 1 cm. E and F, Root length (E) and fresh weight (F) of plants described in D. Three independent experiments were done with similar results, each with three biological repeats. Four plants per genotype from one plate were measured for each repeat. Data are presented as means ± se, n = 3. Statistical significance was determined by ANOVA in combination with posthoc tests; significant differences (P ≤ 0.05) are indicated by different lowercase letters.

