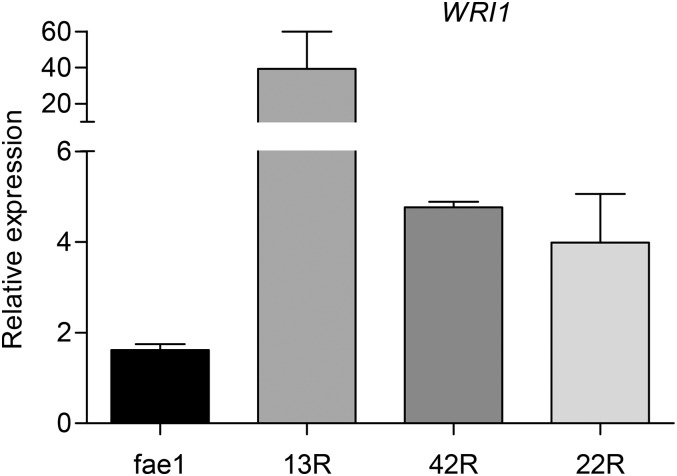
Figure 2.
Transcriptional analysis of WRI1 gene expression. WRI1 transcript level was measured by qRT-PCR in 11- to 12-DAF developing seeds of fae1 and fae1 RcFAH12 WRI1 T3 lines 13, 42, and 22. n = 4, and error bars represent se. Two-tailed Student’s t test, P ≤ 0.05 for all lines compared with fae1.

