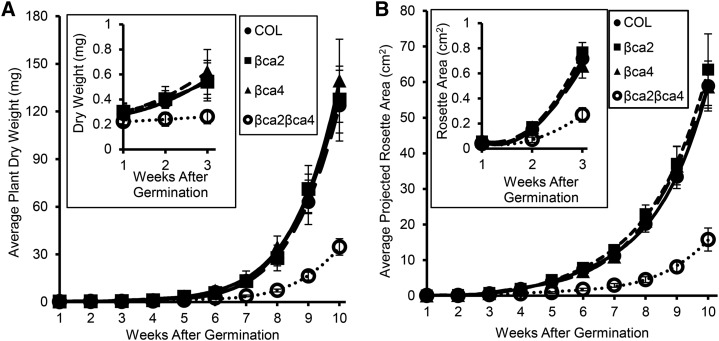
Figure 7.
At 200 μL L−1 CO2, βca2βca4 plants have reduced growth compared with other plant lines. Weekly average aboveground dry weight values (A) and weekly average projected rosette areas (B) show that βca2βca4 plants grow slower than the other plant lines. Each dry weight symbol represents the mean ± sd of five independent plants. Each symbol for projected rosette area represents the mean ± sd of nine independent plants.

