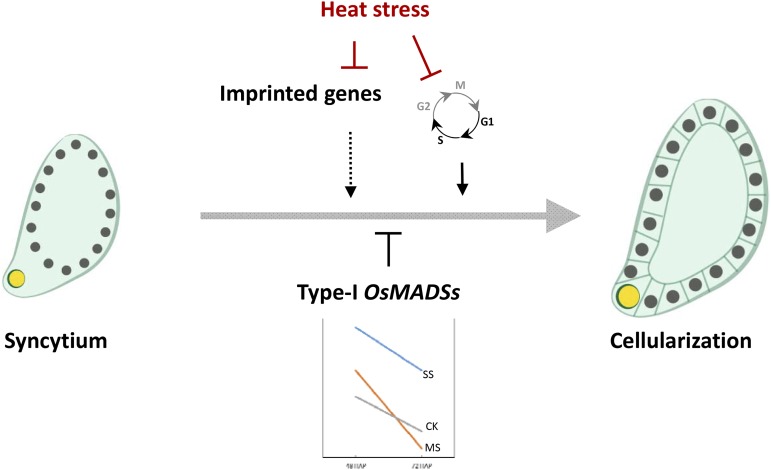
Figure 10.
Proposed model incorporating the main genes and pathways that are impacted when young rice seeds are exposed to heat stress. Arrows and T bars indicate signaling promotion and inhibition, respectively. CK, MS, and SS indicate nonstressed, moderate-stressed, and severe-stressed conditions, respectively.

