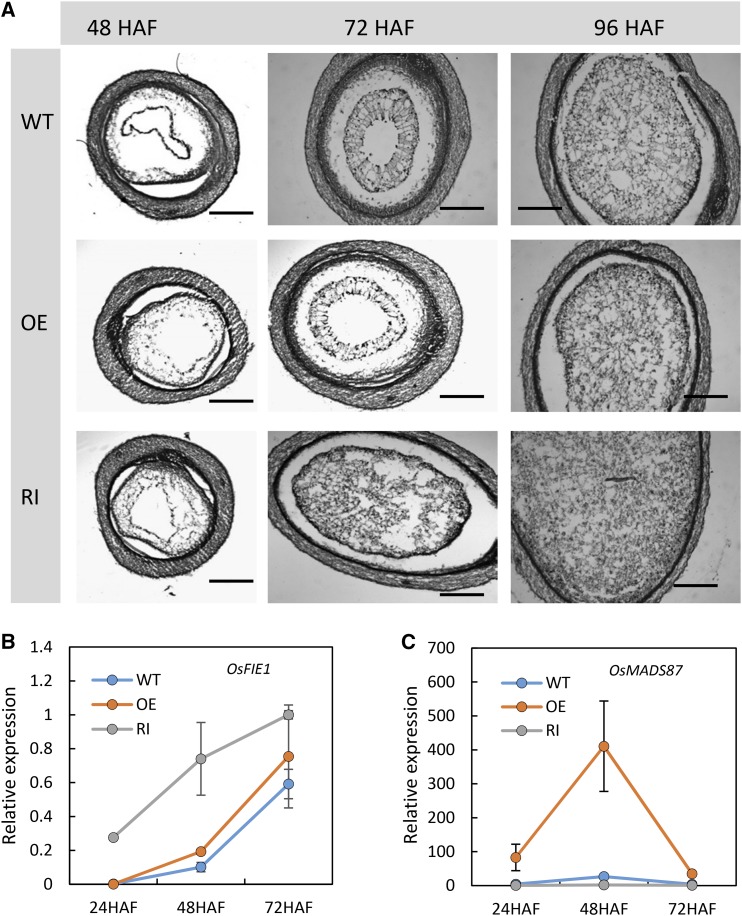
Figure 8.
Histological and expression analyses of wild-type (WT), OE, and RNAi (RI) transgenic seeds. A, Sections of wild-type (top), OE (middle), and RNAi (bottom) seeds at 48 HAF (left), 72 HAF (middle), and 96 HAF (right). Bars = 200 μm. B and C, Relative expression of OsFIE1 (B) and OsMADS87 (C) in developing transgenic and wild-type seeds. Error bars indicate sd.

