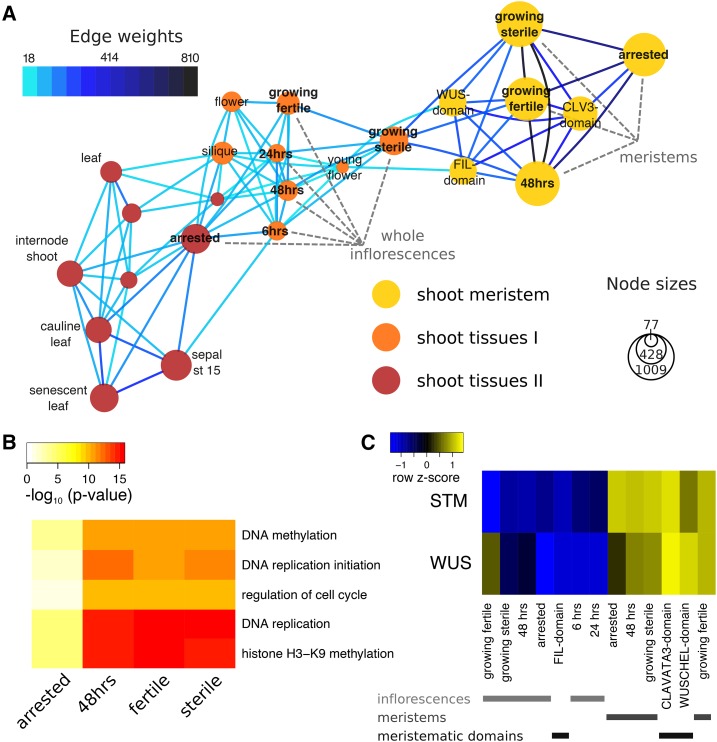
Figure 3.
Gene-sharing network of Arabidopsis tissues. A, Gene-sharing network visualizing shared subsets of genes between tissues. For clarity, only a subset of all tissues in the gene-sharing network is represented; please refer to Supplemental Figure S3 for the full network. Nodes represent tissues, with areas proportionate to the number of genes specific to a given tissue. Edges are drawn only if they contain more genes shared between tissues than expected by chance, and the number of genes represented by an edge is color-coded. Node colors indicate the grouping into network communities. The LAM-isolated “meristem” as well as the “whole inflorescence” samples produced in this study are labeled (gray). B, Example GO terms significantly enriched in meristem nodes. The heatmap represents transformed P values from a test for enrichment of gene-GO term associations within the set of genes in a node. Only five of the terms that vary most in P values between different nodes are shown (see Supplemental Dataset S1 for a full list of significant GO terms). C, Relative expression of the shoot meristem stem cell markers WUS and STM across whole inflorescence samples, as well as LAM-isolated meristems and cell-sorted meristematic domains (Yadav et al., 2009). Colors in the heatmap represent scaled expression estimates, with blue denoting low and yellow denoting high expression, respectively.

