Figure 5.
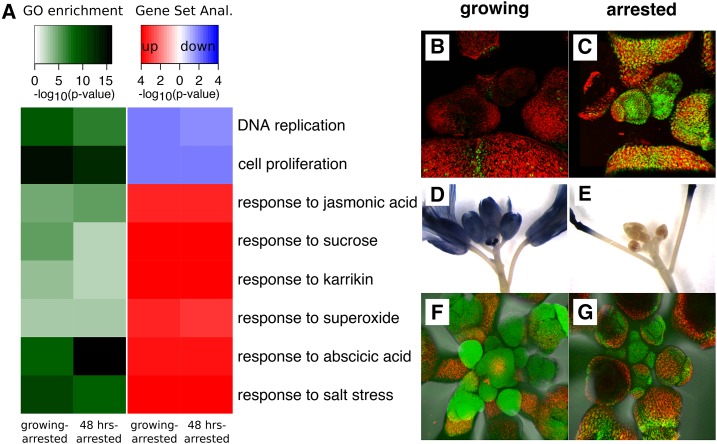
Growth-inhibitory and stress-responsive gene expression increases but ROS levels decrease during GPA. A, Heatmap showing the results of a GO term and subsequent gene set enrichment analysis on genes found to be differentially expressed between arrested and growing or reactivated meristems. The gene set enrichment analysis determines the directionality of gene expression changes within selected GO terms: red colors indicate that genes within a term are up-regulated in arrested meristems, and blue colors indicate that genes within a term are down-regulated. B and C, Confocal imaging of growing (B) or arrested (C) shoot apices of the H1.3-GFP expression marker line. D and E, NBT staining for superoxide in growing fertile (D) or arrested (E) inflorescences. F and G, Fluorescein staining for ROS in either growing fertile (F) or arrested (G) inflorescences. Only representative figures are shown in B to G.

