Figure 6.
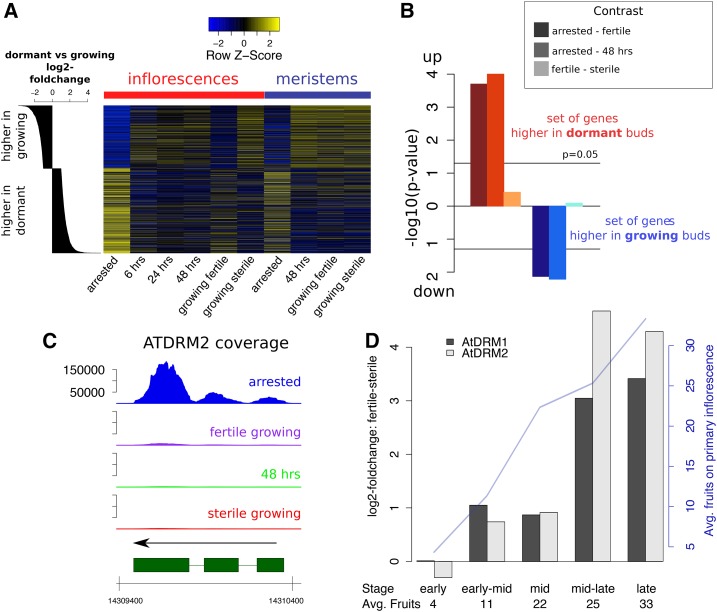
Fruit- and GPA-induced changes resemble axillary bud dormancy. A, Heatmap showing relative expression of genes either more highly expressed in dormant axillary buds (bottom rows) or more highly expressed in activated axillary buds (top rows). Genes are sorted according to log2 fold changes reported by Tatematsu and colleagues (histogram on the left; Tatematsu et al., 2005). Blue colors represent low, yellow colors represent high expression in our microarray dataset. B, Results of a gene set enrichment analysis testing for directionality of expression changes in our meristem RNA-Seq dataset. The gene sets chosen are the groups of genes previously reported to be up- or down-regulated in dormant compared with activated axillary buds (as also seen in A). The three different bars for each test represent different contrasts, e.g. contrasting meristems of arrested versus fertile growing plants, etc. Negative decadal logarithms are represented. C, RNA-Seq normalized coverages across the AtDRM2 genic region in the four meristematic states. D, Estimated expression differences of the AtDRM1 and AtDRM2 genes in fertile versus sterile plants at different stages of development (from “early,” first fertilized fruits emerging from the primary inflorescences, to “late,” proliferative arrest; with n = 3 for each time point and reproductive status). Average numbers of fruits on the primary inflorescence of the fertile plants at each stage are given. A full statistical analysis of the data is shown in Supplemental Figure S6B.

