Figure 5.
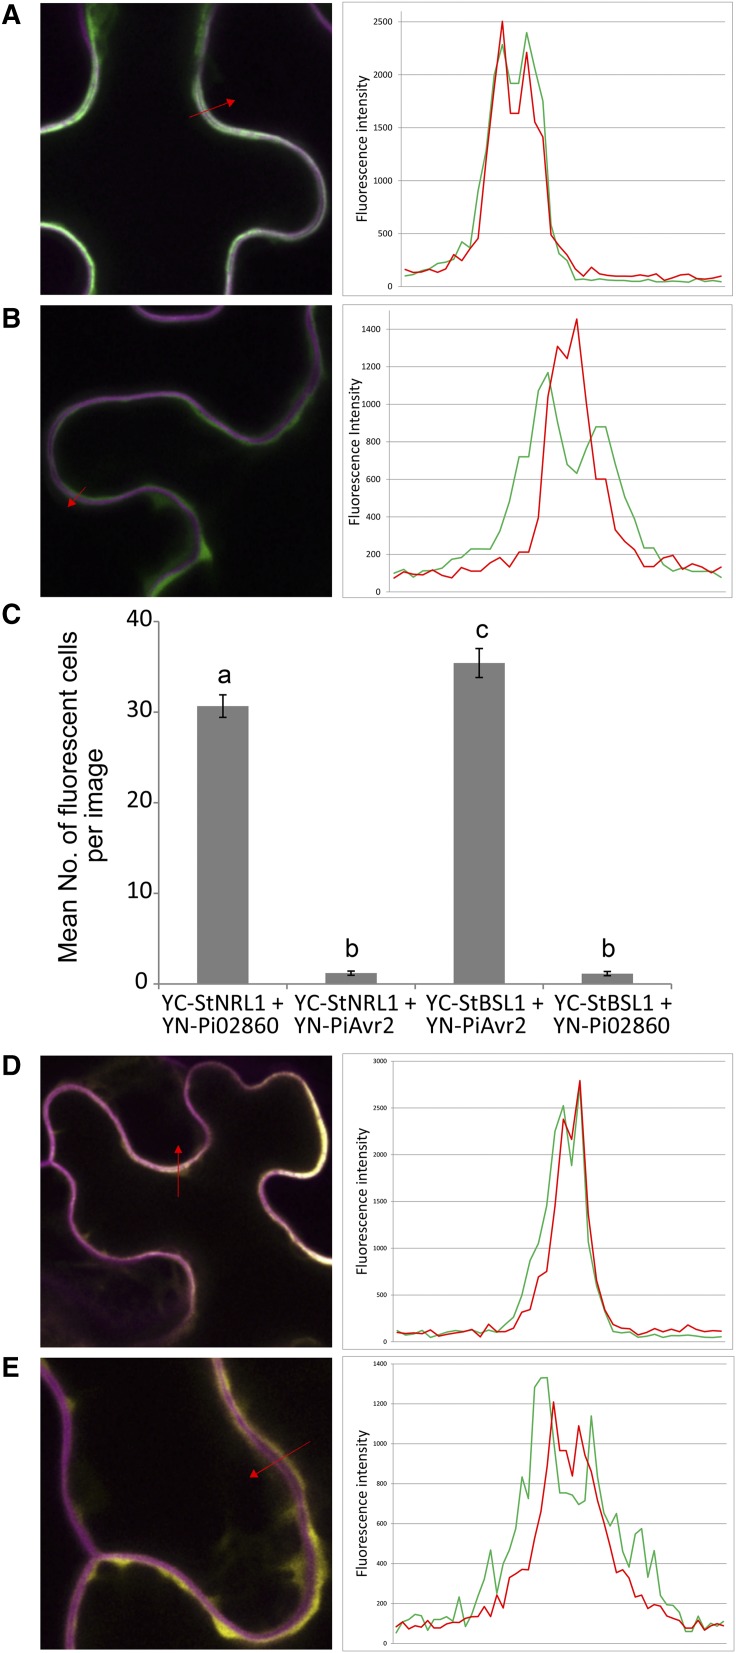
GFP-tagged StNRL1 predominantly locates to the plasma membrane, and bimolecular fluorescence complementation confirms StNRL1 and Pi02860 interaction. A, Single optical slice image across PMs of two adjacent cells coexpressing GFP-StNRL1 and the mOrange-LTi PM marker, with a profile across the membranes in the location indicated by the red arrow. The plot of the profile (right) indicates that the majority of the GFP fluorescence (green line) colocates with the PM marker (red line). B, A comparable profile in a cell coexpressing the PM marker with unfused GFP, which is only present in the cytoplasm. C, Average number of fluorescent cells per image with YC-StNRL1 + YN-Pi02860 and YC-StBSL1 + YNPiAvr2 giving significantly more (P < 0.001, n = 22) reconstitution of YFP fluorescence than when noninteracting effector-interactor pairs are used. Lowercase letters on graphs denote statistically significant differences by one-way ANOVA, with pairwise comparisons performed with the Holm-Sidak method. Results shown are combinations of three independent biological replicates. Error bars show se. D, Single optical slice image across PMs of two adjacent cells coexpressing YC-StNRL1 + YN-Pi02860 and the mOrange-LTi PM marker, with a profile across the membranes in the location indicated (red arrow). The plot of the profile (right) indicates that the majority of the reconstituted YFP fluorescence (green line) colocates with the PM marker (red line). E, A comparable profile in a cell coexpressing unfused YFP in the cytoplasm with the PM marker.

