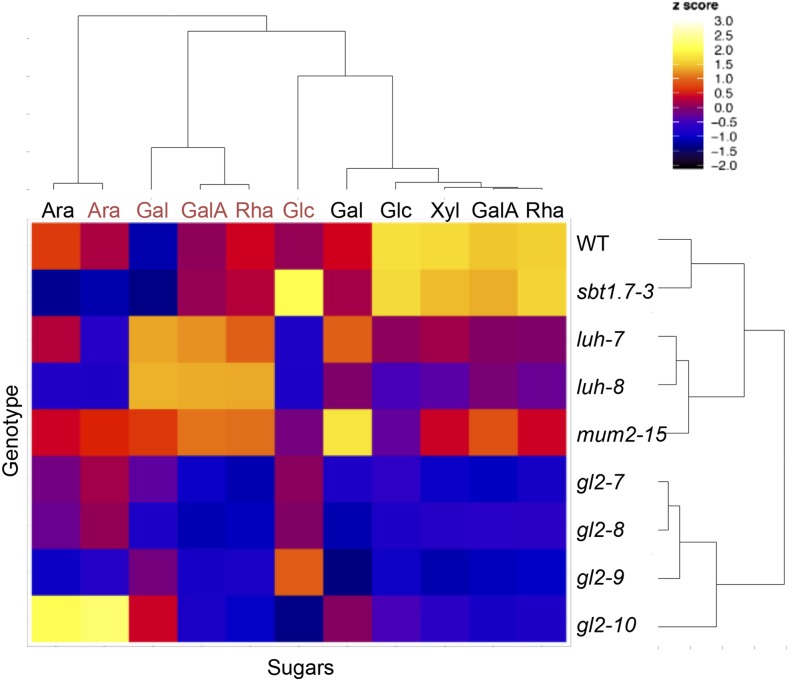
Figure 2.
Clustering of sugars based on their quantity in outer or inner mucilage layers of Arabidopsis mutants. The heat map represents hierarchical clustering data obtained from the quantification of sugars by sequential extraction of outer mucilage with 0.05 m hydrochloric acid (30 min at 85°C, gentle shaking) followed by 0.2 m sodium hydroxide (15 min at room temperature, gentle shaking) labeled in black and inner mucilage sugars by RGase digestion (16 h at 40°C, gentle shaking) labeled in red. Mean values from two biological replicates were normalized, and the color of each block in the map reflects the relative amount of each sugar (from −2 in black to the highest values in white). All genotypes are in the Ws accession. WT, Wild type.

