Figure 6.
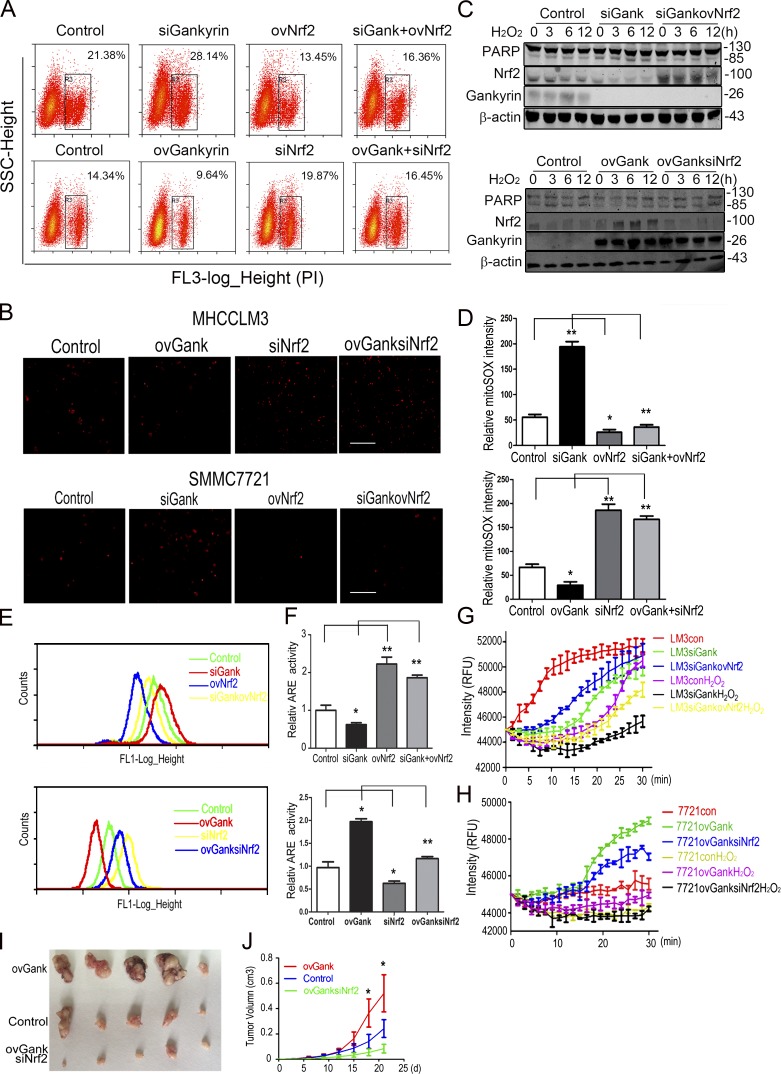
Nrf2 and gankyrin cooperatively provide HCC cells with increased antioxidative stress capacity. (A) MHCCLM3-con, MHCCLM3-siGank, MHCCLM3-ovNrf2, and MHCCLM3-siGankovNrf2 or SMMC7721-con, SMMC7721-ovGank, SMMC7721-siNrf2, and SMMC7721-ovGanksiNrf2 cells were treated with 0.5 mM H2O2 for 5 h and stained with PI for 15 min. Flow cytometry assays were performed to evaluate the level of apoptosis in HCC cells. Representative results from three experiments are shown. (B) Fluorescence microscopy showed the levels of cell death in MHCCLM3-con, MHCCLM3-siGank, MHCCLM3-ovNrf2, MHCCLM3-siGankovNrf2 (top), SMMC7721-con, SMMC7721-ovGank, SMMC7721-siNrf2, and SMMC7721-ovGanksiNrf2 (bottom) cells. Cells were treated with 0.5 mM H2O2 for 5 h and stained with PI for 15 min. Representative results from three experiments are shown. Bar, 100 µM. (C) Levels of cleaved PARP were evaluated in MHCCLM3-con, MHCCLM3-siGank, and MHCCLM3-siGankovNrf2 cells (top) or SMMC7721-con, SMMC7721-ovGank, and SMMC7721-ovGanksiNrf2 cells treated with 0.5 mM H2O2 for the indicated time. Representative results from three experiments are shown. (D) Quantification of the mitoSOX levels in MHCCLM3-con, MHCCLM3-siGank, MHCCLM3-ovNrf2, MHCCLM3-siGankovNrf2, SMMC7721-con, SMMC7721-ovGank, SMMC7721-siNrf2, and SMMC7721-ovGanksiNrf2 cells. The data represent the mean ± SEM of triplicates from an experiment that was repeated a total of three times with similar results. (E) Flow cytometry analyses were performed on MHCCLM3-con, MHCCLM3-siGank, MHCCLM3-ovNrf2, MHCCLM3-siGankovNrf2, and SMMC7721-con, SMMC7721-ovGank, SMMC7721-siNrf2, and SMMC7721-ovGanksiNrf2 cells to detect the levels of ROS. Representative results from three experiments are shown. (F) HCC cells were transiently transfected with an ARE luciferase reporter vector or the control plasmid pRL-TK for 48 h. The cells were then harvested, and the reporter activities were detected. The data represent the mean ± SEM of triplicates from an experiment that was repeated a total of three times with similar results. (G and H) Mitochondrial O2 consumption assays in MHCCLM3-con, MHCCLM3-siGank, MHCCLM3-siGankovNrf2, and SMMC7721-con, SMMC7721-ovGank, and SMMC7721-ovGanksiNrf2 cells. Cells were treated with PBS or 0.5 mM H2O2 for 5 h, and O2 consumption was then examined. Each data point represents the mean ± SEM of triplicates from an experiment that was repeated three times with similar results. (I and J) Tumors were excised from nude mice 25 d after subcutaneous inoculation with SMMC7721-con, SMMC7721-ovGank, or SMMC7721-ovGanksiNrf2 cells. Tumor size was measured once every 3 d, and the overall tumor volume was calculated. The data represent the mean ± SEM. n = 5. *, P < 0.05; **, P < 0.01.

