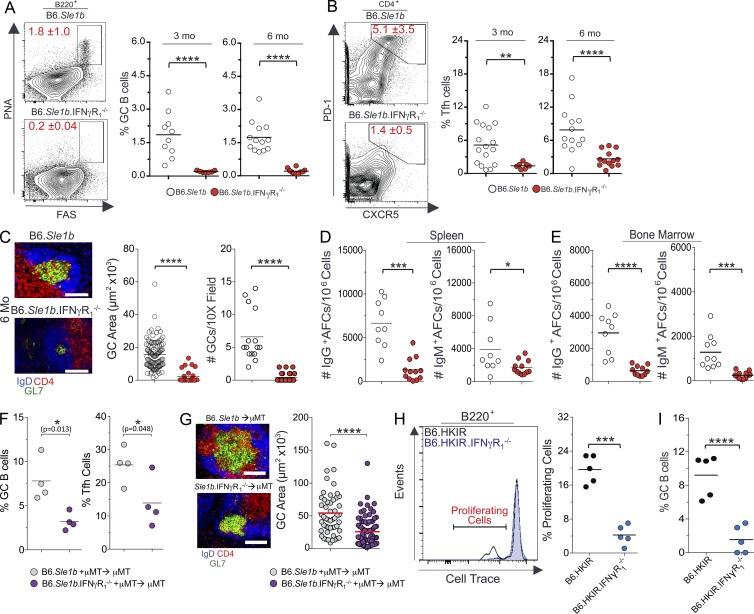
Figure 8.
Reduced Spt-GC responses in global or B cell–specific IFN-γR–deficient autoimmune B6.Sle1b mice. (A and B) Percentages of B220+FashiPNAhi GC B cells (A) and CD4+CXCR5hiPD-1hi Tfh cells (B) were obtained from flow cytometric analysis of spleen cells of 3- and 6-mo-old B6.Sle1b (n = 10) and B6.Sle1b.IFN-γR1−/− mice (n = 10). (C) Representative images of spleen sections from 6-mo-old mice (five mice per group) stained with GL7, anti-CD4, and anti-IgD. GC area measurement (middle) and the quantification of the number of GCs per 10× field (right) are shown. (D) Quantification of IgG+ (left) and IgM+ (right) splenic AFCs in 6-mo-old mice (n = 10 mice per group). (E) Quantification of IgG+ (left) and IgM+ (right) BM AFCs in 6-mo-old mice (n = 9 mice per group). (F) The percentages of B220+FashiPNAhi GC B cells (left) and CD4+CXCR5hiPD-1hi Tfh cells (right) were obtained from flow cytometric analysis of spleen cells from 3-mo-old B6.μMT mice reconstituted with BM cells from B6.Sle1b and B6.Sle1b.IFN-γR1−/− mice (four mice per group). (G) Representative images of spleen sections from μMT mice (four mice per group) described in F are shown (left) in which sections were stained with GL-7, anti-IgD, and anti-CD4. The GC areas (randomly chosen 10 GCs per mouse) from the spleens of mice described in F are shown in the right panel. (H and I) Percentages of B6.HKIR and B6.HKIR.IFN-γR1−/− B cells undergoing proliferation (H) and GC B cell differentiation (I) in recipient mice. Where applicable, each symbol represents a mouse (n = 5 mice per group). The data shown are representative of three independent experiments. Statistical values were determined using an unpaired, nonparametric, Mann–Whitney Student’s t test. Error bars are mean ± SD. *, P < 0.05; **, P < 0.01; ***, P < 0.001; ****, P < 0.001. Bars, 150 µm.

