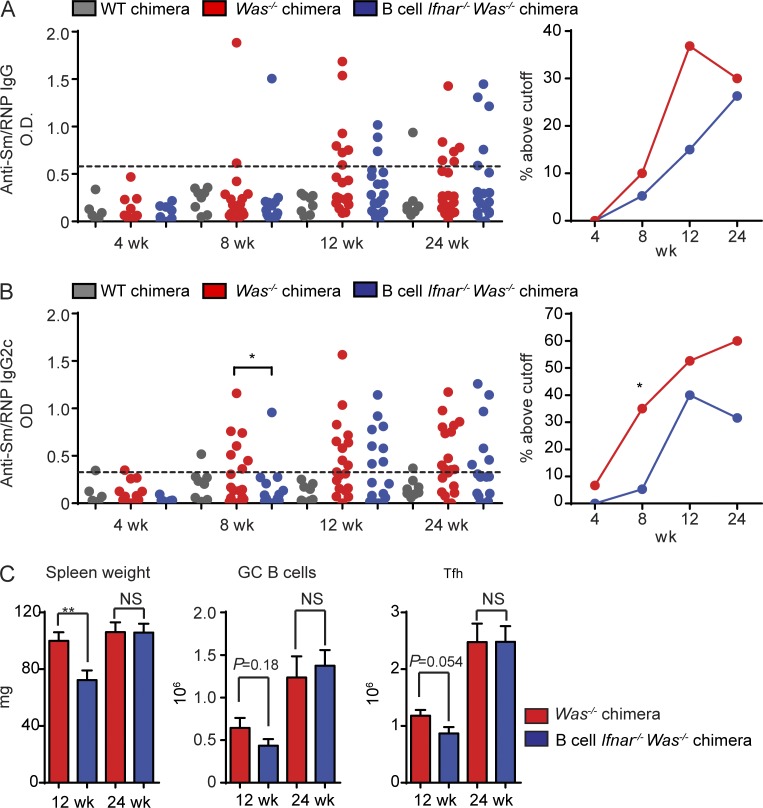
Figure 2.
B cell–intrinsic IFNAR signals accelerate autoimmunity. (A and B) Serum anti-Sm/RNP IgG (A) and IgG2c (B) auto-Ab titers in WT (n ≥ 6), Was−/− (n ≥ 15) and B cell Ifnar−/− Was−/− (n ≥ 9) chimeras at the indicated times after transplantation. (Left) Auto-Ab optical density (OD). (Right) Percentage of mice with reactivity above cut-off (defined as more than three SDs above the mean optical density of WT C57/BL6 serum). (C) Spleen weight and total numbers of PNA+FAS+ GC B cells and PD1+CXCR5+ Tfh cells in Was−/− (n ≥ 10) and B cell Ifnar−/− Was−/− (n ≥ 9) chimeras sacrificed at 12 and 24 wk after transplantation. Error bars indicate SEM. *, P < 0.05; **, P < 0.01, by two-tailed Fischer’s exact test (A and B) or the Mann-Whitney U-test (C). Data are representative of four independent WT, Was−/−, and B cell Ifnar−/− Was−/− chimeras.

