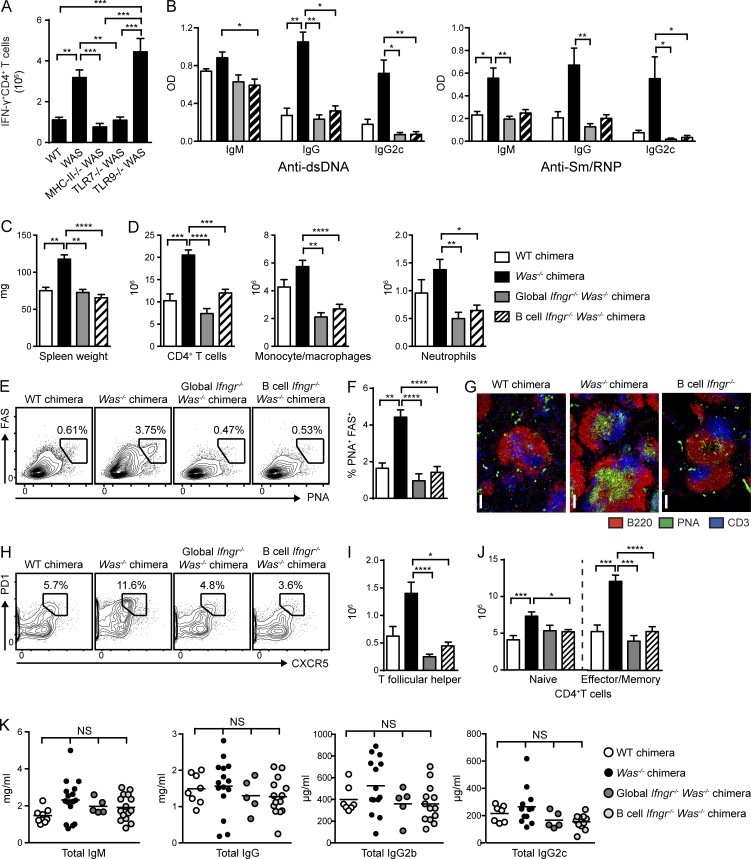
Figure 4.
B cell–intrinsic IFN-γR signals promote spontaneous autoimmune GCs. (A) Number of IFN-γ+CD4+ T cells in WT, Was−/−, and B cell–intrinsic Tlr7−/−, Tlr9−/−, and MhcII−/− chimeras. (B) Anti-dsDNA and anti-Sm/RNP IgM, IgG, and IgG2c auto-Abs (12 wk after transplantation) in WT and Was−/− chimeras as well as Was−/− chimeras with global or B cell–intrinsic deletion of IFN-γR. (C) Spleen weight. (D) Number of splenic CD4+ T cells, CD11b+GR1lo monocyte/macrophages, and CD11b+GR1+ neutrophils. (E and F) Representative FACS plots (E; gated on CD19+) and percentage (F) of splenic PNA+FAS+ GC B cells. (G) Representative splenic sections stained with B220, PNA, and CD3. Bars, 100 µm. (H and I) Representative FACS plots (H; gated on CD4+) and number (I) of splenic PD1+CXCR5+ Tfh cells. (J) Number of naive (CD44LOCD62LHI) and EM (CD44HICD62LLO/HI) CD4+ T cells. (K) Total serum IgM, IgG, IgG2b, and IgG2c titers in the indicated chimeras. Data are representative of five WT (n = 10), five Was−/− (n = 18), two global Ifngr−/− Was−/− (n = 10), and four B cell–intrinsic Ifngr−/− Was−/− (n = 13) chimeras, as well as three Was−/−.Tlr7−/− (n = 14), three Was−/−.Tlr9−/− (n = 15), and two Was−/−.MhcII−/− (n = 8) chimeras sacrificed at 24 wk after transplantation. Error bars indicate SEM. *, P < 0.05; **, P < 0.01; ***, P < 0.001; ****, P < 0.0001, by the Kruskal-Wallis one-way ANOVA.

