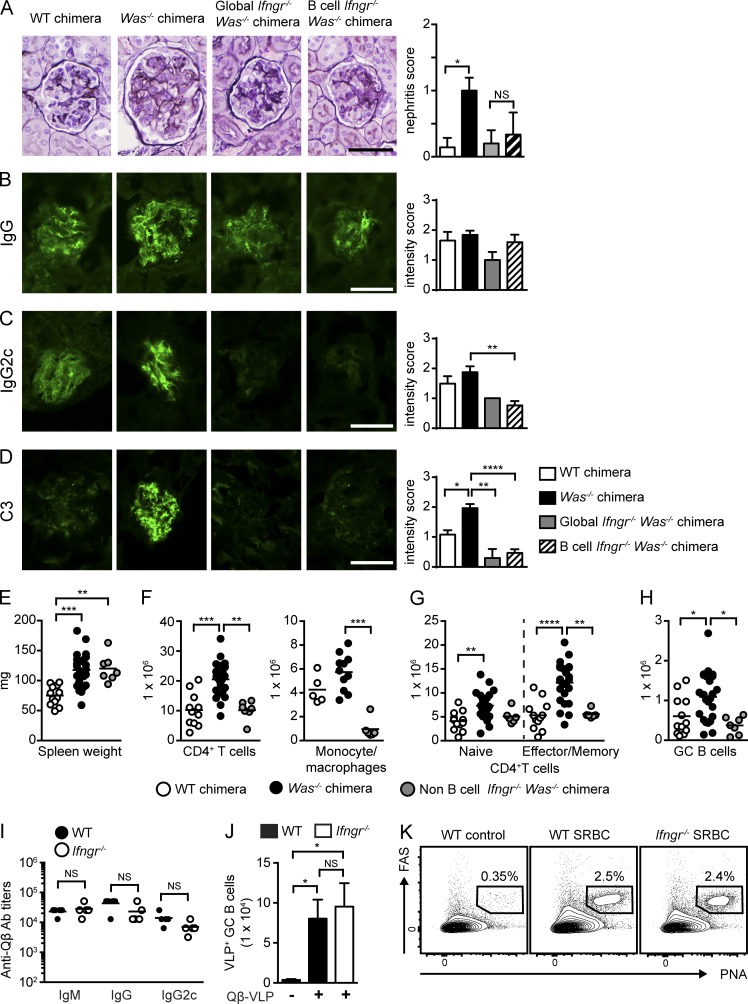
Figure 5.
B cell–intrinsic IFN-γR deletion prevents immune complex glomerulonephritis; IFN-γ promotes autoimmunity but is not required for antiviral responses. (A, left) Representative renal histology. (Right) Glomerular inflammation score. Data are representative of two or more independent chimeras, WT (n = 6), Was−/− (n = 7), global Ifngr−/− Was−/− (n = 5), and B cell–intrinsic Ifngr−/− Was−/− (n = 6) chimeras. (B–D) IF staining for glomerular IgG (B), IgG2c (C), and C3 (D). (Left) Representative images. (Right) Intensity of glomerular IF staining. IF intensity scored by observers blinded to genotype. Data are representative of two or more independent chimeras, WT (n = 8), Was−/− (n = 16), global Ifngr−/− Was−/− (n = 5), and B cell–intrinsic Ifngr−/− Was−/− (n = 15) chimeras. (E–H) Spleen weight (E); number of splenic CD4+ T cells and CD11b+GR1lo monocyte/macrophages (F); number of naive and EM CD4+ T cells (G); and number of GC B cells (H). Data are representative of five WT (n = 11), five Was−/− (n = 18), and two non–B cell Ifngr−/− Was−/− (n = 7) chimeras. (I) Isotype-specific anti-Qβ Ab titers in WT (n = 4) and Ifngr−/− (n = 4) mice at day 7 after VLP immunization. (J) Total number of splenic Qβ-VLP+ GC B cells in immunized WT and Ifngr−/− mice. (K) Representative flow plots showing expansion of splenic PNA+FAS+ GC B cells in SRBC immunized WT and Ifngr−/− mice. Numbers indicate the percentages in the PNA+FAS+ gate. Lines indicate mean values. (I and J) Data are representative of two independent experiments. Bars, 50 µm. Error bars indicate SEM. Lines indicate mean values. *, P < 0.05; **, P < 0.01; ***, P < 0.001; ****, P < 0.0001, by the Kruskal-Wallis one-way ANOVA (A–H and J) or the Mann-Whitney U-test (I).

