Figure 2.
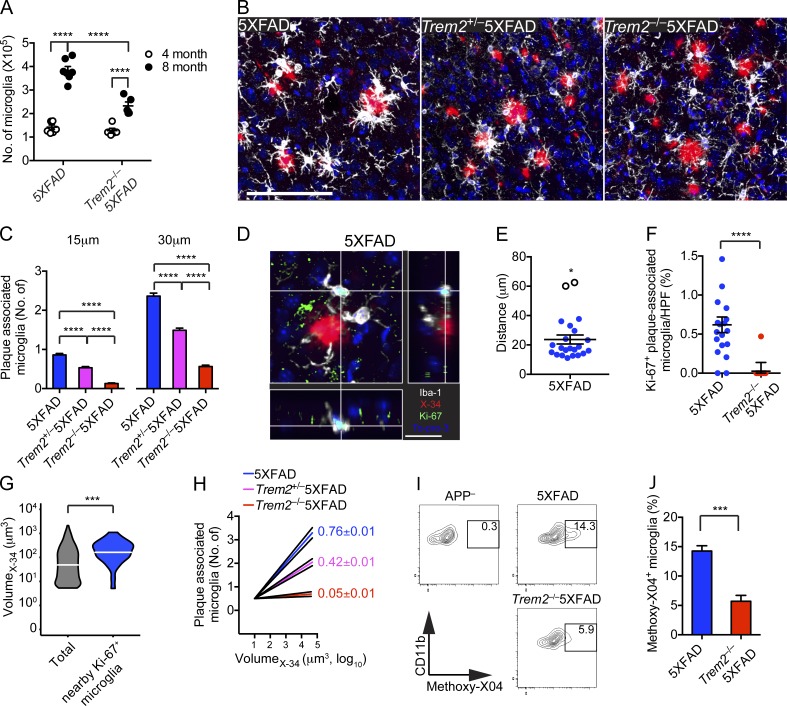
Impaired microglial response to Aβ deposits in Trem2−/− 5XFAD mice is apparent by 4 mo. (A) Total numbers of microglia in the cortices and hippocampi of 5XFAD and Trem2−/− 5XFAD mice at 4 and 8 mo of age. (B and C) Microglial response to Aβ plaques in 4-mo-ol 5XFAD, Trem2+/− 5XFAD, and Trem2−/−5XFAD mice. (B) Representative images show matching cortical regions stained with X-34 (red) for amyloid plaques and Iba-1 (white) for microglia. Nuclei were visualized with To-pro3 (blue). (C) Numbers of microglia within 15 or 30 µm of Aβ plaques. (D–F) Microglia proliferation in 5XFAD and Trem2−/− 5XFAD mice was assessed by determining nuclear localization of Ki-67. (D) Representative sectional view of a confocal image shows expression of Ki-67 (green), microglia (Iba-1; white), and nuclei (blue). The proximity of Ki-67+ microglia to Aβ plaques (X-34, red), in cortices of 5XFAD mice is visualized. (E) Proximity of Ki-67+ microglia to the nearest plaque in cortices of 5XFAD. Unfilled circles (*) represent outliers as determined by q-test. (F) Frequencies of Ki-67+ microglia per HPF in 5XFAD and Trem2−/−5XFAD mice. (G) The volume of all observed Aβ plaques and Aβ plaques with Ki-67+ in close proximity were compared. (H) The log10-transformed volume of plaques was plotted against the number of microglia within 15 µm. Numbers represent slope ±95% confidence interval. (I and J) 5XFAD and Trem2−/− 5XFAD mice were injected with methoxy-X04 and the percentage of microglia with internalized methoxy-X04 (indicative of fibrillar Aβ) was determined by flow cytometry. (I) Representative plots show methoxy-x04 positivity of CD11b+CD45lo cells. APP transgene negative (APP–) littermates were used as negative controls. (J) The frequency of methoxy-X04+ microglia was quantified. Bars: (B) 100 µm; (D) 20 µm. Error bar represents mean ± SEM. *, P < 0.05; ***, P < 0.001; ****, P < 0.0001, Mann-Whitney (A, F, and J) and q-test (E). Data represent a total of five to seven mice per group (A–F). For confocal images, a total of four random HPF were analyzed per mouse.

