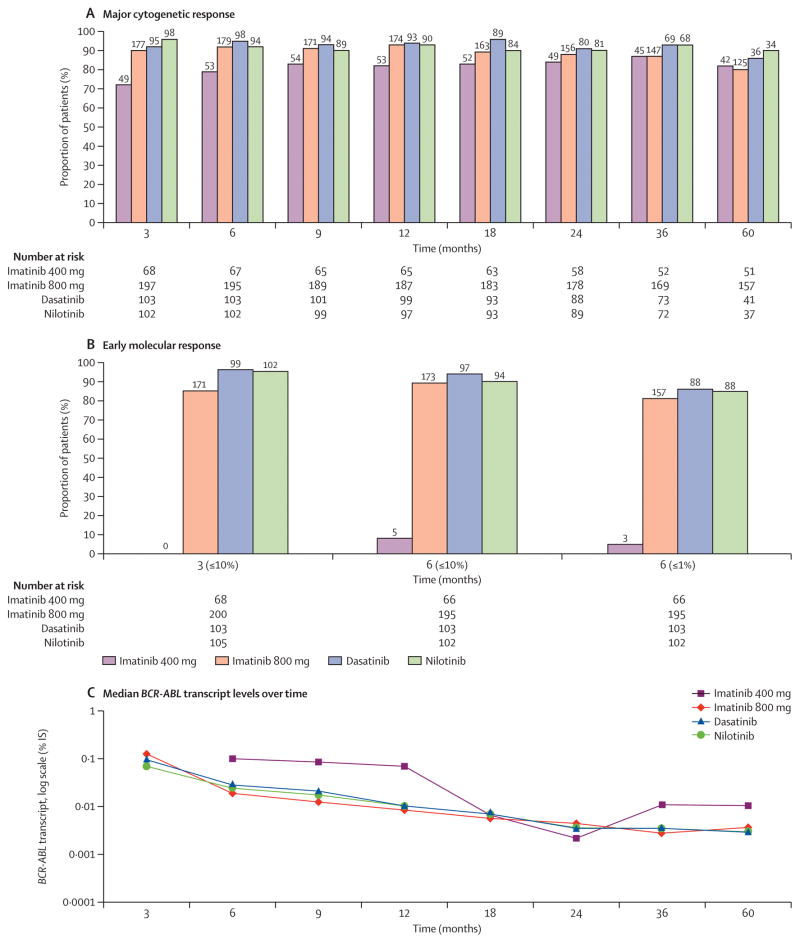
Figure 2. Analysis of cytogenetic and molecular response at specific time points (3, 6, 9, 12, 18, 24, 36 and 60 months) by TKI modality.
A) Achievement of complete cytogenetic response (CCyR) (0% Ph-positive metaphases), percentages (top) and absolute numbers of evaluable patients (bottom) are shown for imatinib 400, imatinib 800, dasatinib and nilotinib respectively B) Achievement of major molecular response (MMR) (≤0.1% BCR-ABL-IS) percentages (top) and absolute numbers of evaluable patients (bottom) are shown for imatinib 400, imatinib 800, dasatinib and nilotinib respectively. Of note for imatinib 400 group, number of patients with available PCR values were (0 and 5 at 3 and 6 months respectively) C) Achievement of molecular response (MR4.5) (≤0.0032% BCR-ABL-IS).

