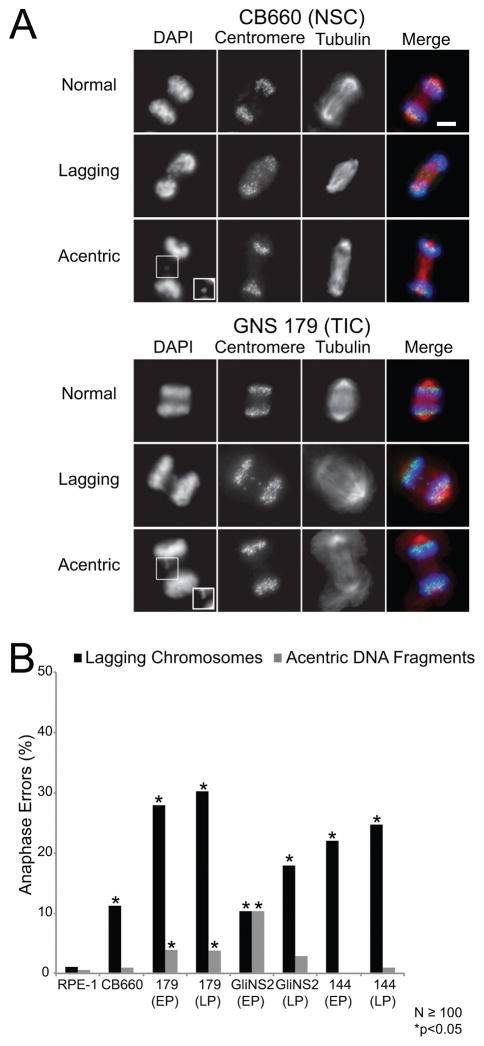
Figure 1. GNS cells have anaphase defects.
(A) Representative images of anaphases that were categorized as normal, those with lagging chromosomes, or those with acentric DNA fragments for control CB660 neural stem cells (NSCs) and GNS 179 TICs. Lagging chromosomes have centromeres localized between the two separating daughter nuclei while acentric DNA fragments do not have detectable centromere signal. Shown in the images are DNA (blue), centromeres (green), and microtubules (red). The insets are contrasted images to enhance the acentric DNA fragments. Scale bar, 5μm. (B) Percentage of anaphase defects in control RPE-1 and CB660 cells and the TICs GNS 179, GNS 144, and GliNS2. EP indicates early passage and LP late passage that is 20 or more passages in culture relative to the early passage cells. For the CB660 and GNS cells, 8 or more replicate coverslips were analyzed for N≥100 anaphases scored and *p<0.05, Fisher’s exact test compared with control RPE-1 cells.

