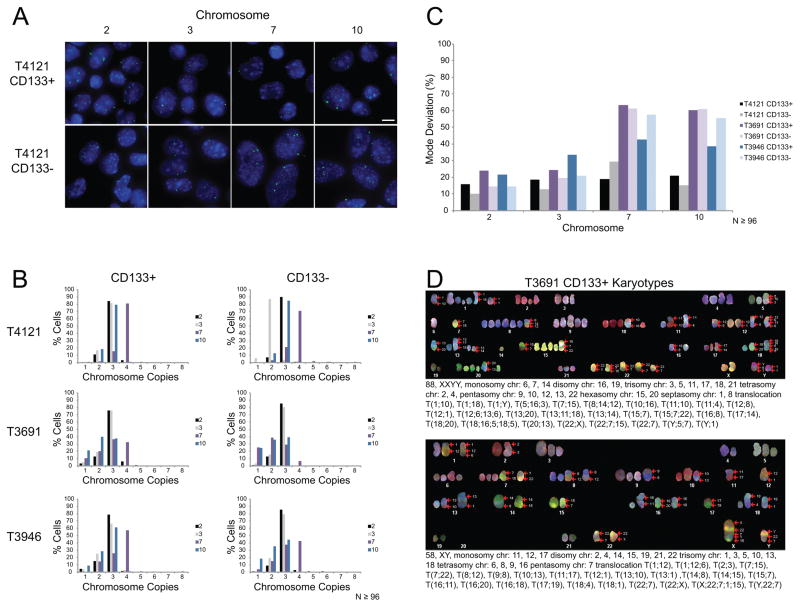
Figure 4. PDX cells are aneuploid and have a CIN phenotype.
(A) Representative images of FISH analysis for the glioblastoma PDX line T4121. PDX cells were sorted into CD133+ TICs and CD133- non-TICs. Chromosome copy number variations were determined using centromeric DNA probes for chromosomes 2, 3, 7, and 10. Scale bar, 10μm. (B) Histograms showing the distribution of chromosome copies. N≥96 total nuclei scored per probe. (C) Bar graph showing the percentage of cells that deviate from the modal chromosome copy number derived from data in panel B. (D) Two representative karyotypes from SKY analysis of T3691 CD133+ TICs.

