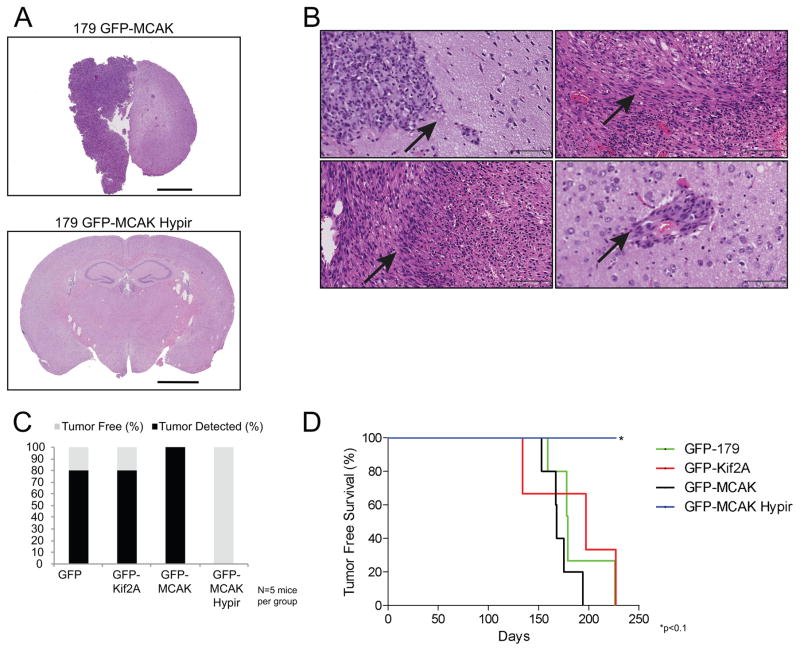
Figure 7. Increasing CIN inhibits tumor formation.
(A) Representative hematoxylin and eosin stained brain sections of mice injected with GNS 179 GFP-MCAK (top panel) or GFP-MCAK Hypir (bottom panel) cells. A tumor is clearly evident in the brain of the animal injected with GFP-MCAK expressing cells while there is no indication of a tumor in the brain of the animal injected with GFP-MCAK Hypir expressing cells. In total, N=5 mice were injected with 100,000 GNS 179 GFP, GFP-Kif2A, GFP-MCAK, or GFP-MCAK Hypir expressing cells. Scale bar, 2000μm. (B) Representative hematoxylin and eosin stained sections highlighting the pathological features of the intracranial tumors that developed in mice injected with GNS 179 GFP, GFP-Kif2A, and GFP-MCAK cells. The upper left panel shows tumor tissue adjacent to normal brain tissue (arrow). The upper right panel is an example of desmoplasia that developed in tumors (arrow). The bottom left panel is an example of pseudopalisading in tumors (arrow). The bottom right panel is an example of tumor cells infiltrating into normal brain tissue (arrow). Scale bar, 25x-100μm. (C) Percentage of brain tumors detected in mice injected with GNS 179 GFP, GFP-Kif2A, GFP-MCAK, or GFP-MCAK Hypir expressing cells by the 312 day endpoint of the experiment. (D) Tumor free survival curves of mice that were sacrificed prior to the 312 day endpoint of the experiment. *p<0.1, Log-rank (Mantel-Cox) test compared to mice injected with GNS 179 GFP expressing cells.

