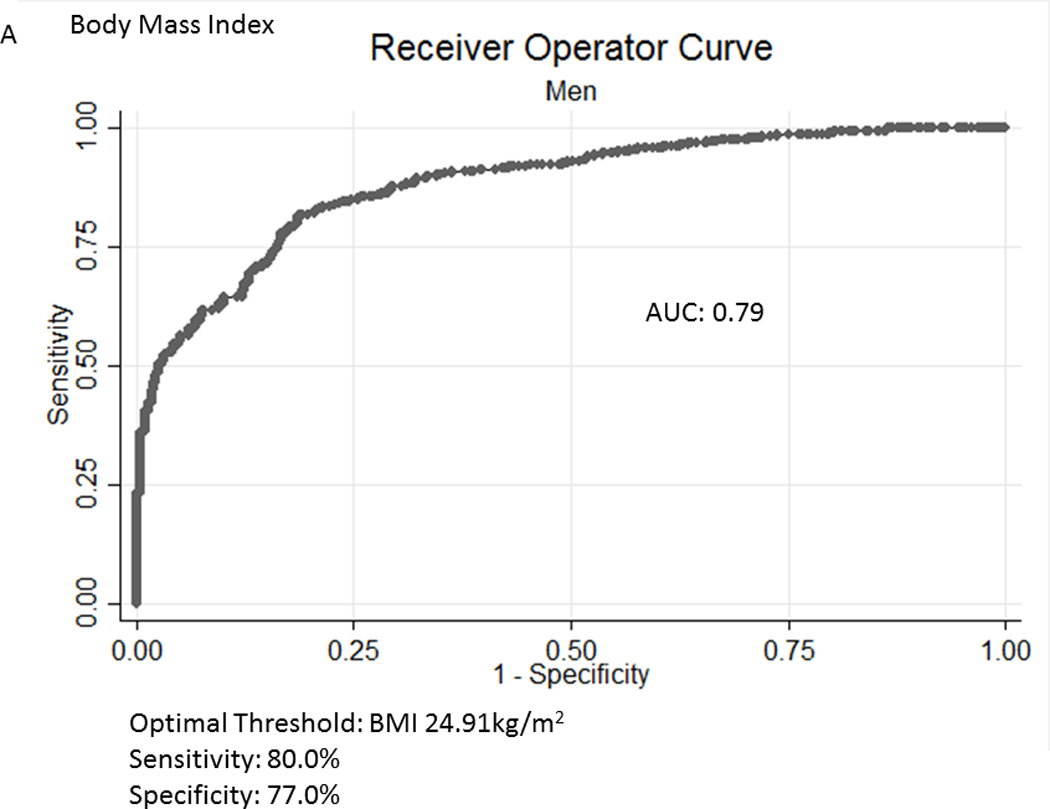
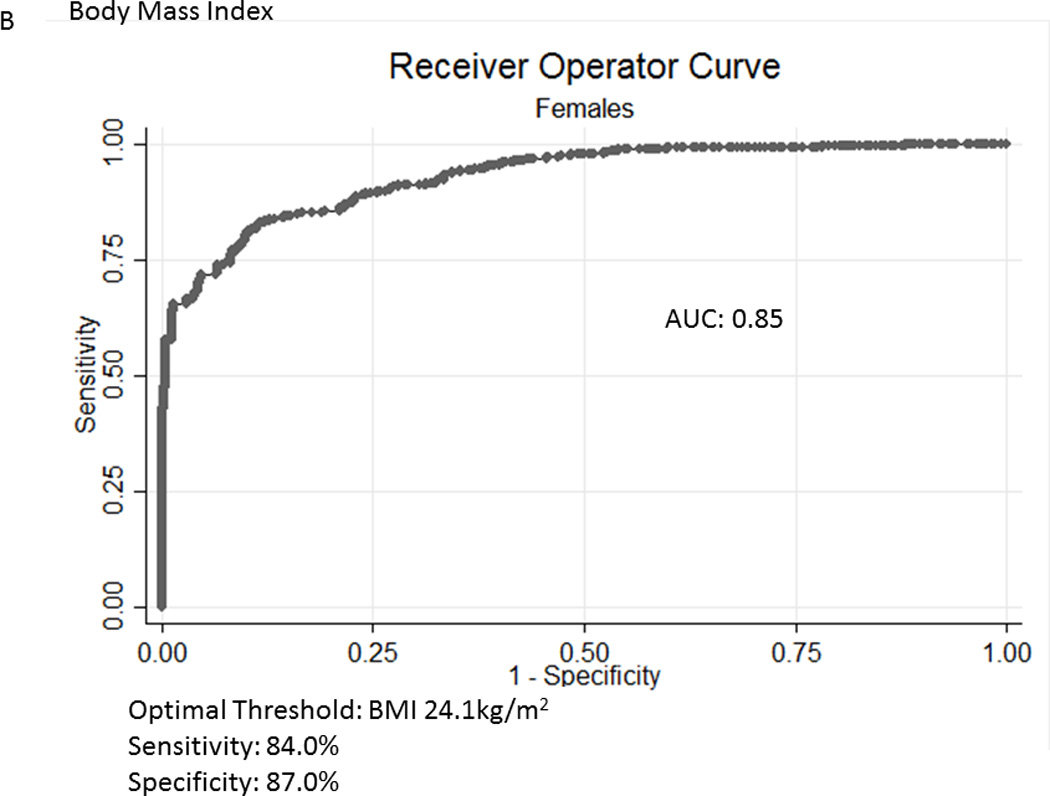
Figure 1.


A, B Receiver Operator Curves for body mass index (BMI) for all subjects aged ≥60years in the National Health and Nutrition Examination Survey 1999-2004 sample included in this analysis to detect body fat percentage by sex. Men - Figure a; Females – Figure b.
