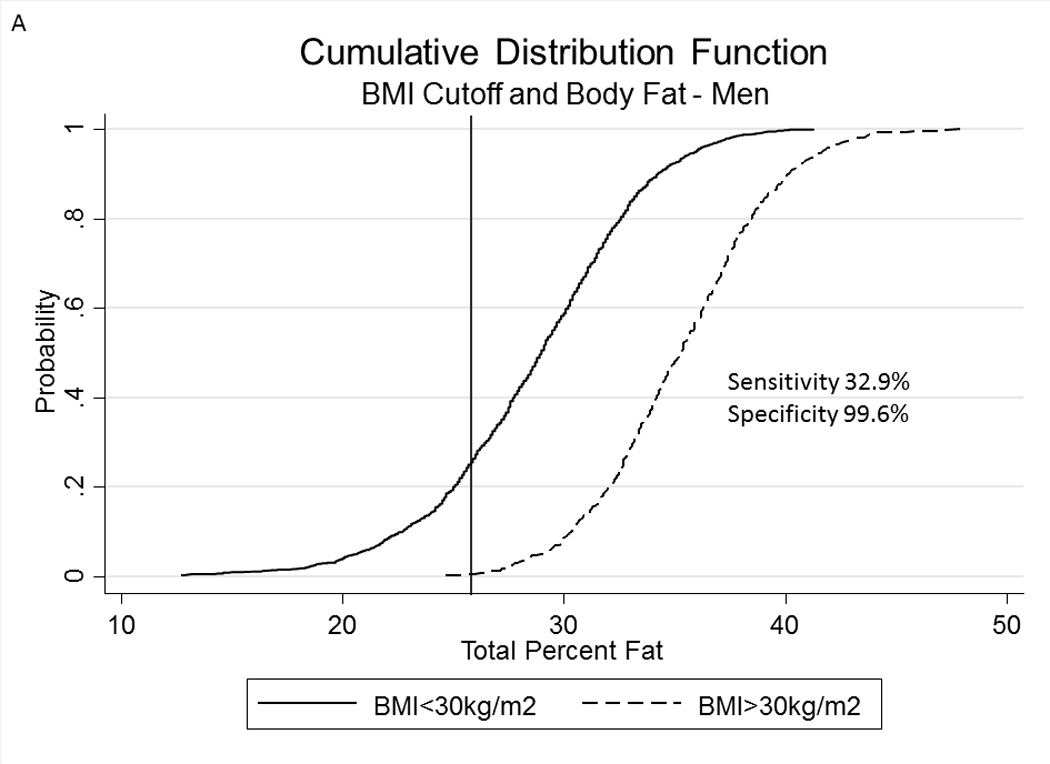
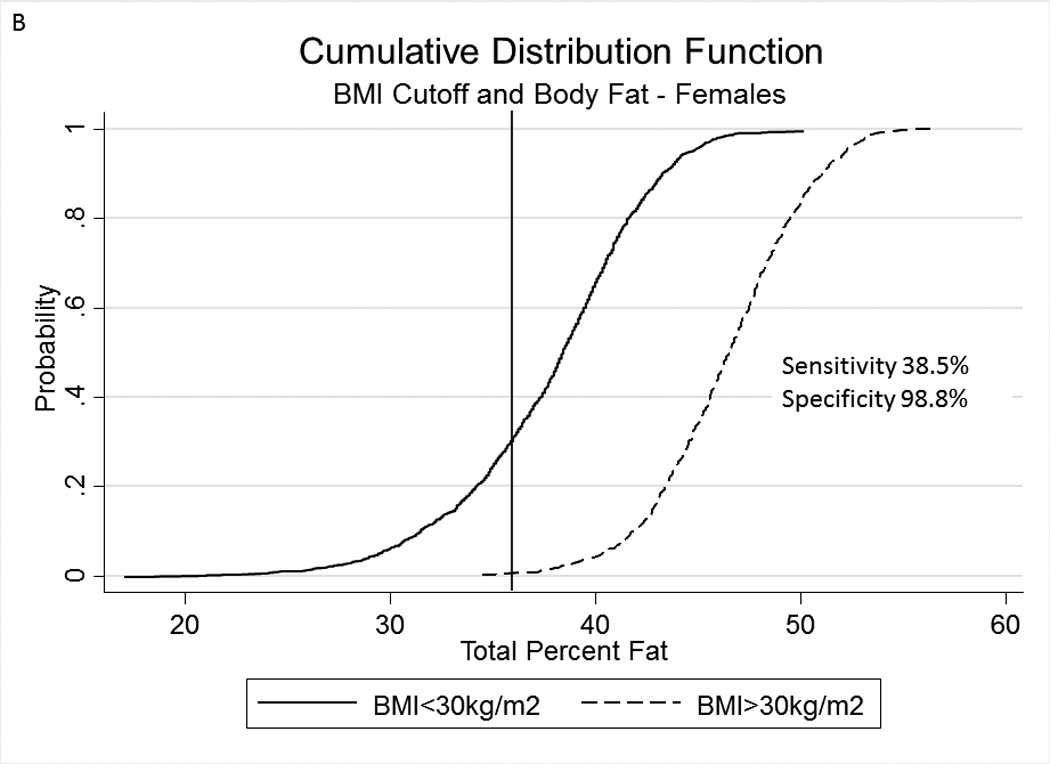
Figure 3.


A, B Cumulative Distribution Functions of percent body fat in men (panel A) and females (panel B) in subjects with a body mass index ≥30kg/m2 and <30kg/m2. Vertical lines represent percent body fat cutoffs for males (25%) and females (35%).
