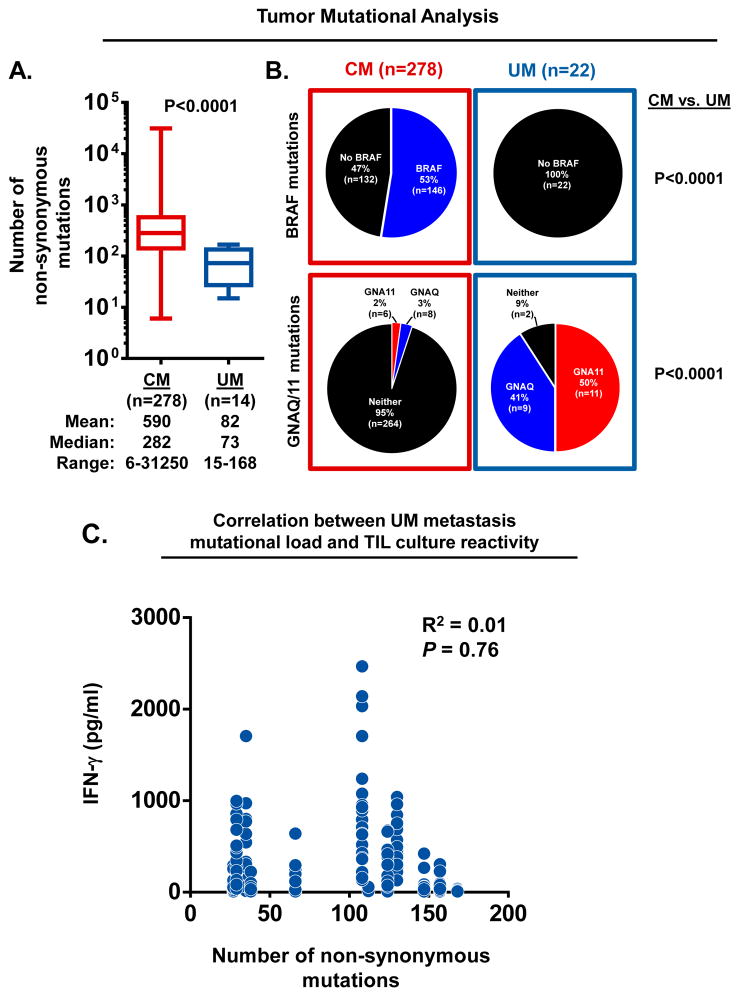
Figure 5. Tumor mutational profiles of CM and UM metastases.
(A) Comparison of the number of non-synonymous mutations identified in CM and UM metastases. Box extends from 25th to 75th percentile, line through the box indicates median, and bars extend from the smallest to largest values. Statistical comparison between CM and UM cohorts was performed with the Student’s t test. (B) Frequency of BRAF, GNAQ and GNA11 mutations identified in CM and UM metastases. Statistical comparison of oncogene frequency between CM and UM were performed with Fisher’s exact test. (C) Correlation between the number of non-synonymous mutations identified in UM metastases and the autologous anti-tumor reactivity of their derived TIL cultures. Data represents UM TIL cultures (n~24) established from metastases from 12 UM patients. Each dot plots the mutation frequency of the parental tumor (x-axis) versus the IFN-γ production of the derived UM TIL cultures in response to overnight co-culture with autologous tumor digest minus the background cytokine levels of unstimulated TIL and tumor digest alone (y-axis). Linear regression analysis was used to derive R2 values.

