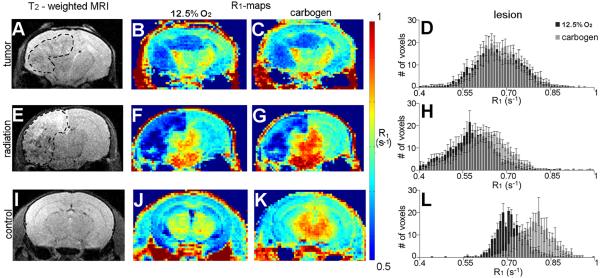
Figure 2.
Representative T2-weighted images (A,E,I), R1-maps (B–C, F–G, J–K), and R1-histograms (D,H,L) from mice with tumors, mice with radiation necrosis, and untreated control-state mice during alternate free breathing of the hypoxic gas and carbogen. Tumor and radiation necrosis lesions are conspicuous in R1-maps acquired during both breathing gas conditions (B–C, F–G). Qualitatively, these lesions are more obvious in R1-maps than in standard T2-weighted images (A,E), where lesions are delineated with a dashed line for clarity. The differences in R1 between breathing gas conditions are evident in R1-maps acquired from mice with radiation necrosis (F–G) and control-state mice (j–K), but not in tumor-bearing mice (B–C). A broad, oxygen-induced shift in voxel-wise R1 values in control-state cortex was observed in lesion-specific histograms (Fig. 3L). A smaller shift in voxel-wise R1 values was observed in radiation necrosis lesions (Fig. 3H). No shift in voxel-wise R1 was observed in tumor lesions (Fig. 3D).

