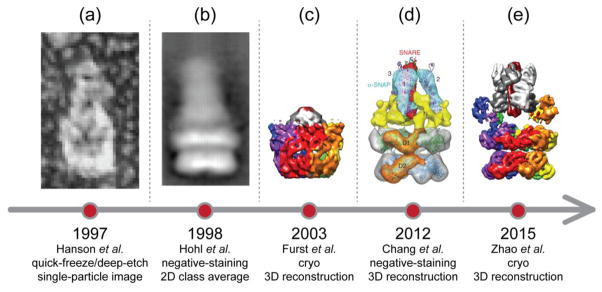
Fig. 2. A history of EM studies on 20S supercomplex.
Representative images or reconstructions are shown on the time axis. They are adapted from Figure 6 of Hanson et al., 1997 (panel a), Figure 2 of Hohl et al., 1998 (panel b), and Figure 6 of Chang et al, 2012 (panel d), respectively. In addition, the maps of Furst et al., 2003 (panel c) and Zhao et al., 2015 (EMD-6206, state I, panel e) are recolored in the same scheme as in Figures 3 and 4.

