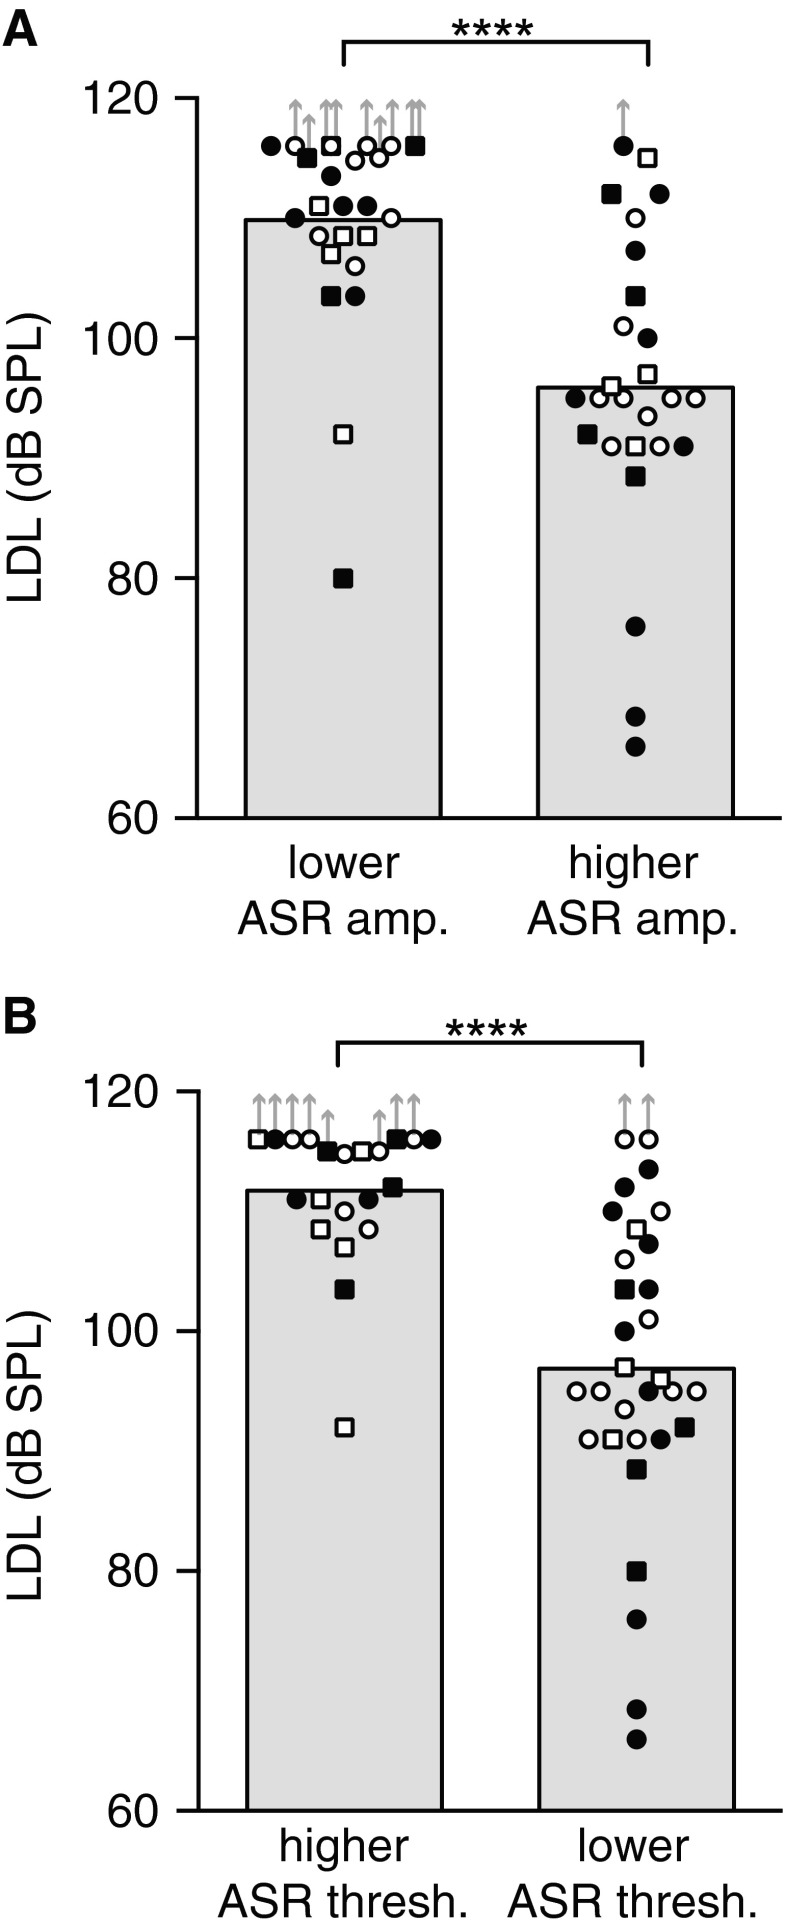
FIG. 9.
ASR amplitude (A) and ASR threshold (B) can be used to define subject groups differing significantly in LDL. Subjects were grouped by whether their ASR amplitude (threshold) lay above the median for all subjects, or at or below the median. Mean LDL for the noise stimulus for each group is indicated by the gray bars. Symbols correspond to individuals. Filled symbols: tinnitus. Open symbols: no tinnitus. Circles: men. Squares: women. Upward arrows indicate plotted LDL value was a lower bound on the measurement. Asterisks denote significance of Mann–Whitney tests: U(50) = 88 and 133 in noise and quiet, respectively, ****p < 0.0001. Session 1 data.

