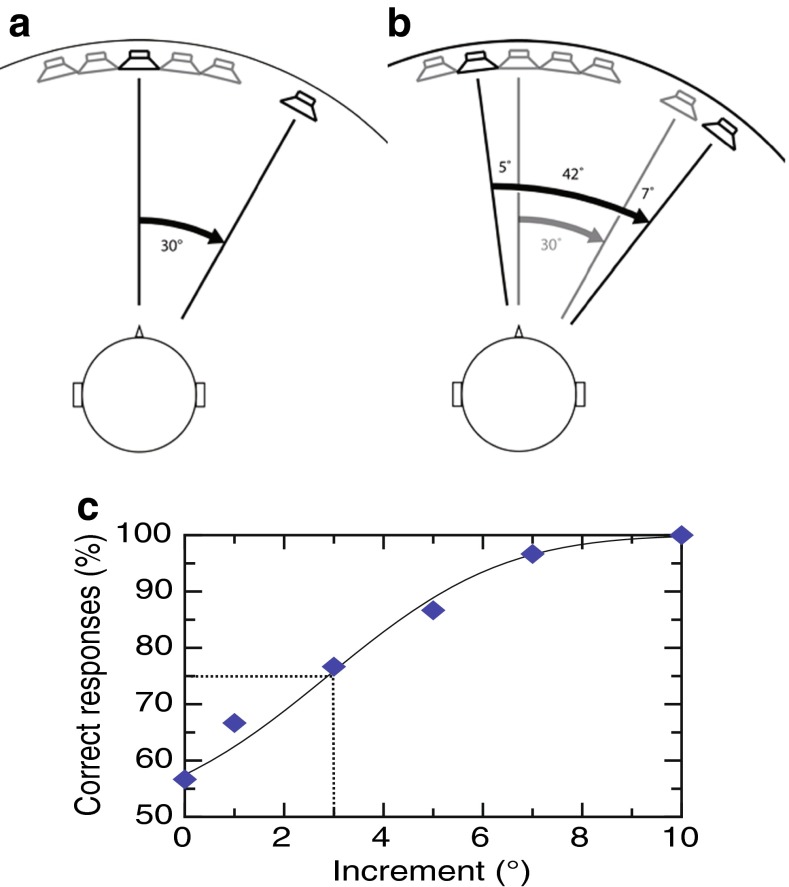
FIG. 1.
A, B Schematic of the experimental setup for the anterior field, as viewed from directly above the listener. A fixed array of five speakers, each separated by 5 °, and a single speaker attached to a movable robotic arm (black outer circle) are located in front of the participant. In each interval, participants are concurrently presented two spatially separated sounds. Participants reported the interval that contained the wider spatial separation. A An example standard interval: /da/ is presented at 0 ° using the middle speaker in the array and /ee/ 30 ° to the right of the midline using the speaker on the movable arm. This produces a spatial separation of 30 °, the base separation in this trial. Active speakers and their sound direction lines are in black and inactive speakers are in gray. B An example test interval: /da/ is presented 5 ° to the left of the midline using a fixed speaker and /ee/ is presented 37 ° to the right of the midline using the speaker on the movable arm. This results in a spatial separation of 42 °, which corresponds to an increment of 12 ° on the base separation of 30 °. The gray lines show the spatial separation in the previous interval. The left and right endpoints were varied across trials and neither was ever in the same location, preventing participants reporting a change in the location of one of the tokens. C Data from a representative subject for a single base separation in the free-field task. The percentage of correct responses is plotted as a function of the increment presented, with each point representing the average of 18 trials. The line shows the best-fitting cumulative Gaussian function from which thresholds are calculated. The dotted lines show the increment corresponding to 75 % correct performance.

