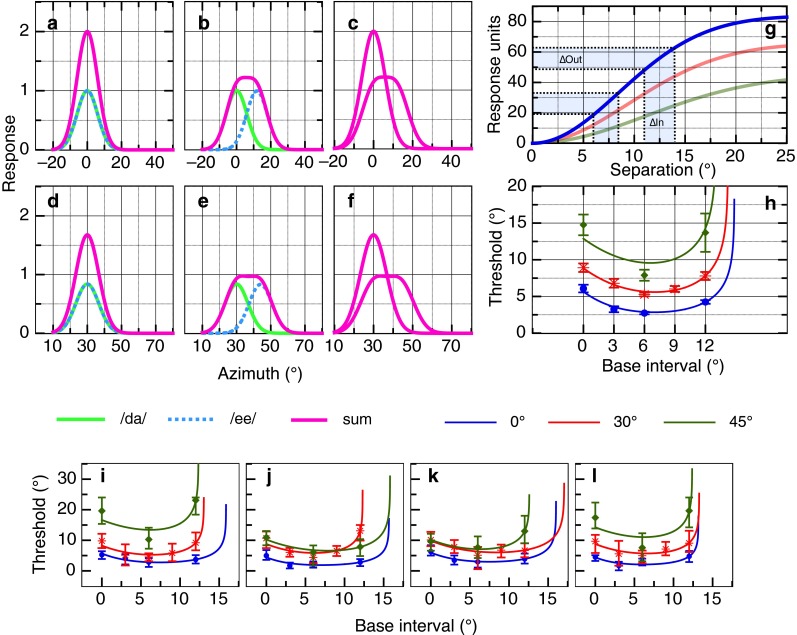
FIG. 6.

Proposed model for free-field spatial separation discrimination. A Two collocated responses (blue and green) located at lateral offset of 0 ° each of magnitude 1, the sum forms a single peak of amplitude 2.0 (magenta line). B Two spatially separated responses (blue and green); the summed response forms a flattened peak (magenta line). C The summed Gaussian responses taken from A and B. D Two collocated responses located at a lateral offset of 30 ° as in A but each with a magnitude of 0.8. E Two spatially separated responses as in B. F The summed Gaussians taken from D and E. The effect of the gain (attenuation) factor for more eccentric location can be seen by the reduction in amplitude of the responses D–F, with the summed response reaching a maximum of 1.6. G The summed Gaussian responses (magenta lines) in C are subtracted from each other, and the sum of the square of this difference is taken across all azimuth values. This produces a sigmoidal pattern of accelerating nonlinearity followed by compressive nonlinearity (blue curve). The red curve shows this computation for F and the green curve for an eccentricity of 45 ° (summed Gaussians not illustrated). H Measured thresholds and predictions from the model. Thresholds were simulated by assuming correct discrimination requires a constant change in response output from the functions shown in (G—e.g., blue shading). I–L Predicted and measured thresholds for four participants who completed all three lateral offset conditions. All error bars are 95 % confidence intervals. See text for further details.
