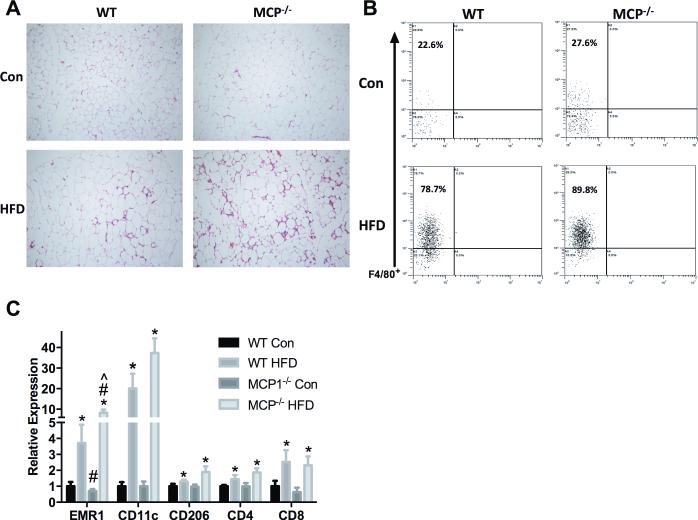
Figure 3.
Inflammatory cell population. A. Epididymal fat H&E staining. B. Flow cytometric analysis of F480+ cells from cells that were positively selected for CD11b+. C. Relative gene expression of macrophage and T cell markers in epididymal fat. *main effect of diet, #main effect of genotype. ^interaction between HFD groups. Data are represented as ± SEM and representative of two individual experiments, n=7 WT Con, n=7 WT HFD, n=7 MCP Con, n=8 MCP HFD.

