Fig. 4.
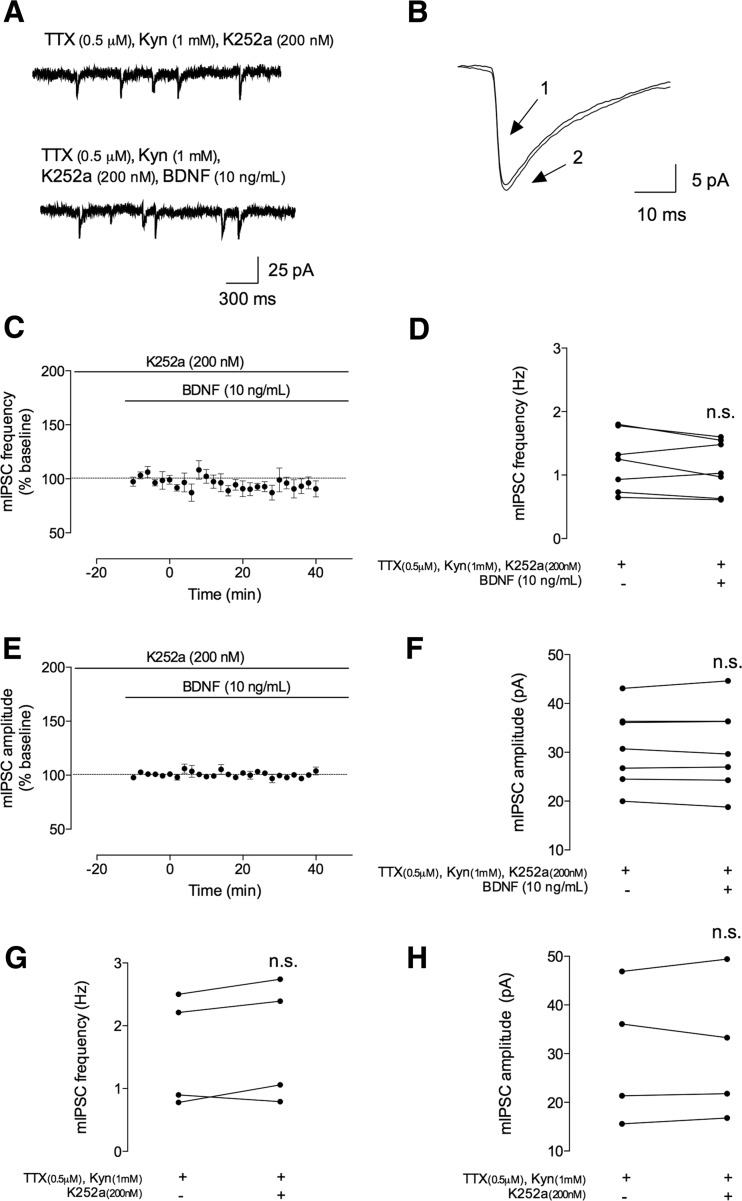
The facilitatory effect of BDNF on mIPSCs is dependent on TrkB receptor activation. The mIPSCs were recorded in the same conditions as described for Fig. 2. During all the recordings, a tyrosine kinase inhibitor (K252a, 200 nM) was further added to the perfusion. a In the upper panel, a representation of mIPSC tracings recorded in the absence (upper trace) and presence (lower trace) of BDNF (10 ng/mL). b Representative average tracings of mIPSCs of two superimposed events in the absence (1) and presence (2) of BDNF (10 ng/mL), from the same cell. c, e Time course changes in mIPSC frequency (c) and amplitude (e) induced by application of BDNF (n = 7). mIPSC frequency and amplitude changes were quantified by comparing the events before (baseline) and after BDNF application. d, f Averages of the absolute values of frequency (d) or amplitude (f) are shown as individual data in the absence (−) and presence (+) of BDNF (n = 7). g, h Averages of the absolute values of frequency (g) or amplitude (h) are shown as individual data obtained in the absence (−) or presence (+) of K252a (n = 4). Values are mean ± SEM. n.s. p > 0.05 (two-tailed paired Student’s t test

