Fig. 6.
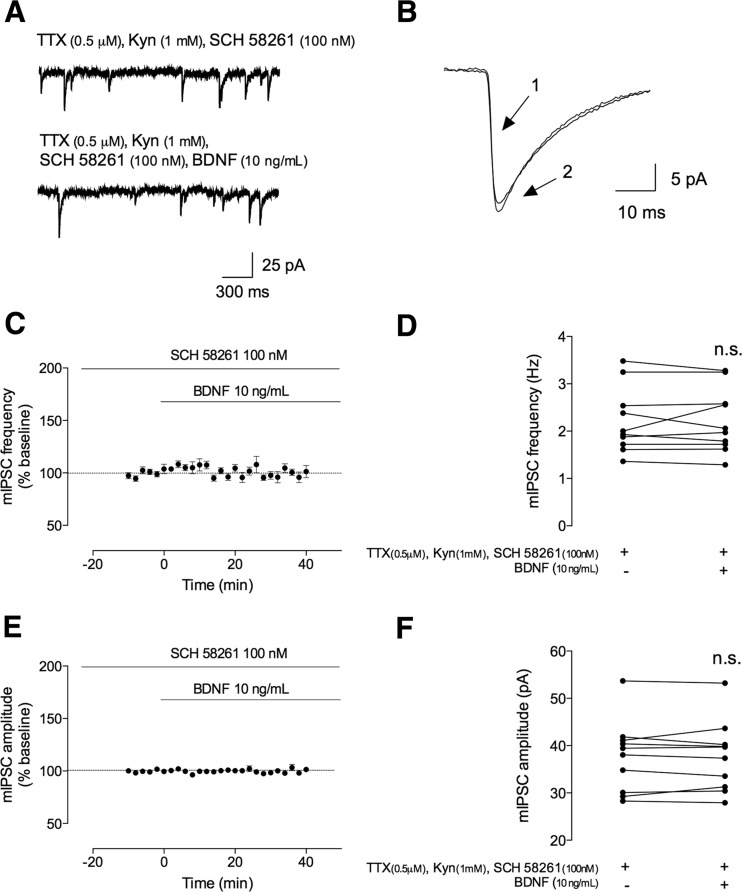
BDNF-mediated effect on mIPSC frequency is dependent on adenosine A2A receptor activation. The mIPSCs were recorded in the same conditions as described for Fig. 2. During all the recordings, an adenosine A2A receptor antagonist was further added to the perfusion. a In the upper panel, a representation of mIPSC tracings recorded in the absence (upper trace) and presence (lower trace) of BDNF (10 ng/mL). b Representative average tracings of mIPSCs of two superimposed events in the absence (1) and presence (2) of BDNF (10 ng/mL), from the same cell. c, e Time course changes in mIPSC frequency (c) and amplitude (e) induced by application of BDNF (n = 10). mIPSC frequency and changes were quantified by comparing the events before (baseline) and after BDNF application. d, f Averages of the absolute values of frequency (d) or amplitude (f) are shown as individual data obtained in the absence (−) and presence (+) of BDNF (n = 10). Values are mean ± SEM. n.s. p > 0.05 (two-tailed paired Student’s t test

