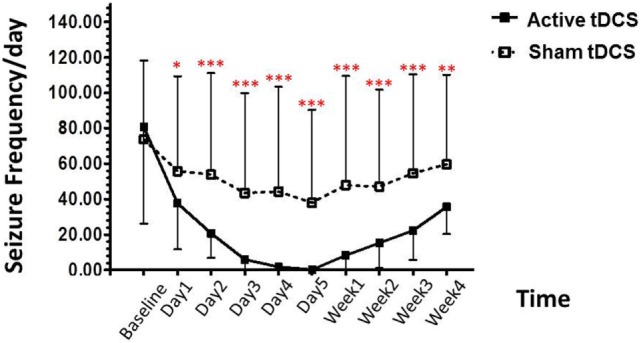
Figure 2.

Effect of tDCS on seizure frequency. Data are presented as mean ± SD of number seizure frequency/day at baseline, treatment period (day 1–day 5), and various time points after treatment: 1, 2, 3, and 4 weeks. *p = 0.004, **p = 0.002, and ***p < 0.001 as compared to sham tDCS condition.
