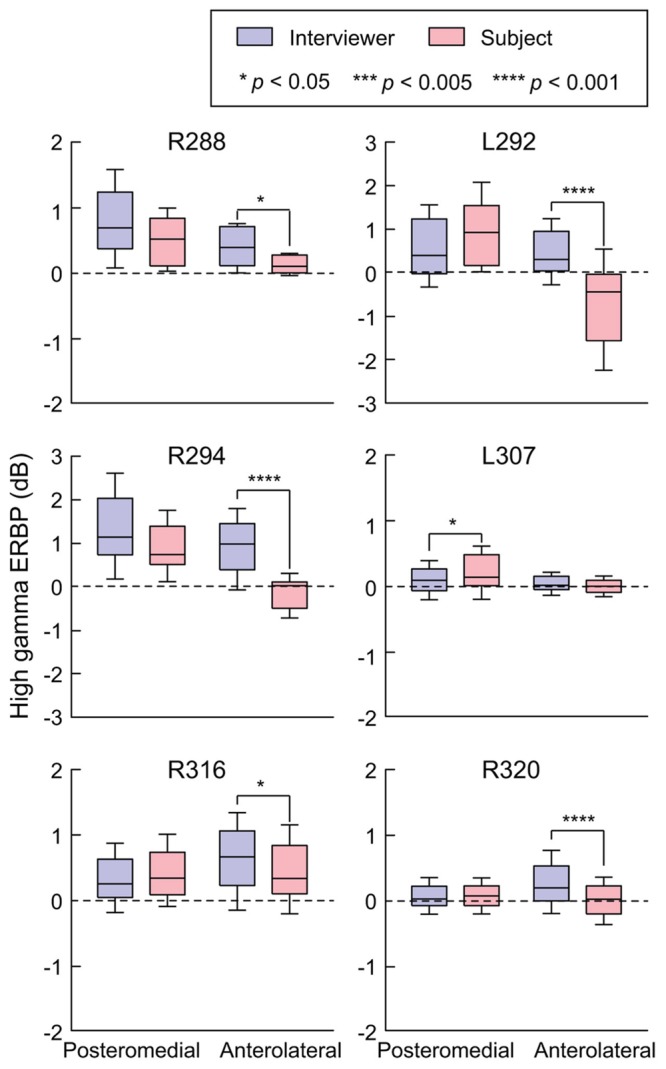
FIGURE 3.

Summary of HG ERBP analysis. High gamma power was log-transformed and normalized to the mean power over the entire duration of the recording. Box plots show median, quartile, 10th and 90th percentile values of high gamma ERBP averaged over all interviewer’s and subject’s utterances (blue and red boxes, respectively) and recording sites within each ROI in each subject. Significance of ERBP differences was evaluated using Wilcoxon rank sum tests, followed by FDR correction.
