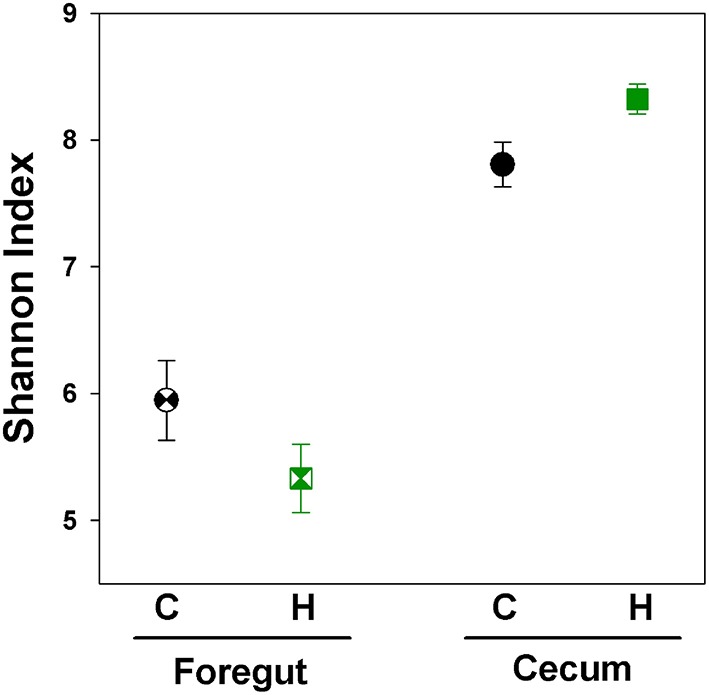
Figure 4.

Shannon index of microbial communities of voles selected for different traits. Points represent mean ± SEM. C, Control; H, Herbivorous. The foregut chamber harbored lower microbial diversity than the cecal chamber. No difference in diversity was observed between the foregut communities of Control and Herbivorous-selected voles. Cecal communities of Herbivorous-selected lines were significantly more diverse than Control lines. The points for cecal samples represent the same samples as presented in Figure 2, except here we used a lower number of sequences per sample for analysis, due to a slightly lower return of sequences from some foregut samples.
