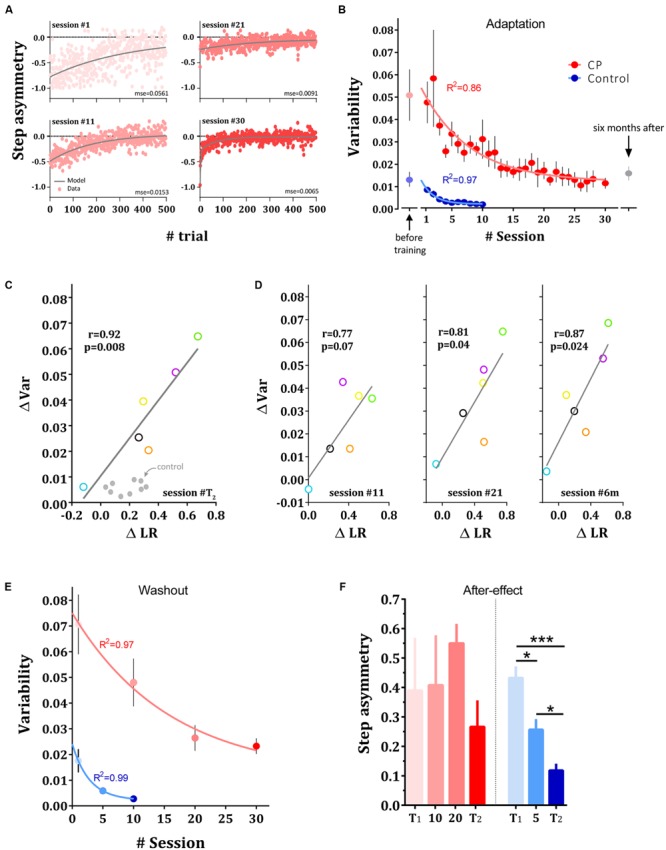
FIGURE 3.

Changes in variability in adaptation and washout sessions. (A) Reduction in variability across sessions. Experimental results and model fit. Data points are step asymmetry for representative subject from CP group in sessions 1, 11, 21, and 30. Gray line is the fit for the dual-exponential function. MSE for each session is presented bellow each curve. (B) Changes in variability averaged across adaptation sessions in control (blue dots) and CP group (red dots). Faint dots represent the variability during the first baseline session prior to the training. Curves represent the single exponential fit to the mean data for each group, respectively. Gray point represents the execution variability in CP 6 months after the adaptation sessions. (C) Inter-subject correlation between the improvements in the estimated learning rate (ΔLR) and the reduction in variability (ΔVar) in CP subjects when comparing T2 with T1. (D) Correlation between change on learning rate and reduction in variability after 11 sessions (left panel), 21 sessions (middle panel) and 6 months after training (right panel). (E) Changes in variance across washout sessions in control (blue dots) and CP group (red dots). Curves represent the single exponential fit to the mean data for each group, respectively. (F) After-effect in the washout sessions in both groups. Bars show the mean across subjects and error bars represent standard error of means (±SE). Significance levels is depicted by asterisks –∗p < 0.05, ∗∗∗p < 0.001.
