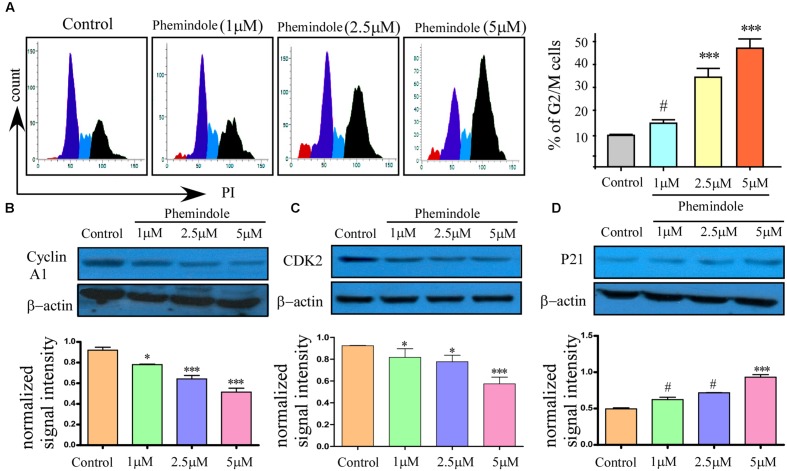
FIGURE 7.
Anti-mitotic property of Phemindole on MDAMB-231 cells. (A) Phemindole induced cell cycle arrest in the G2/M phase in MDA-MB cells. Cells were treated for 24 h with Phemindole at different concentrations as indicated, cells were processed for cell cycle analysis (left panel). Quantified Graphical plot on the right panel. (B–D) Western blot analysis was performed to check the expression of cell cycle-associated proteins in presence of Phemindole in different concentration; β-actin was used as a loading control. Quantification of band intensity in respect to loading control was shown in bar diagram (lower panels). Blots are representative of three independent experiments and quantifications are indicated by bar diagram. Values were normalized by intensity of loading control. ∗,∗∗,∗∗∗,# indicate p < 0.05, p < 0.01, p < 0.0005, p > 0.05 respectively versus untreated or control group.

