Figure 3.

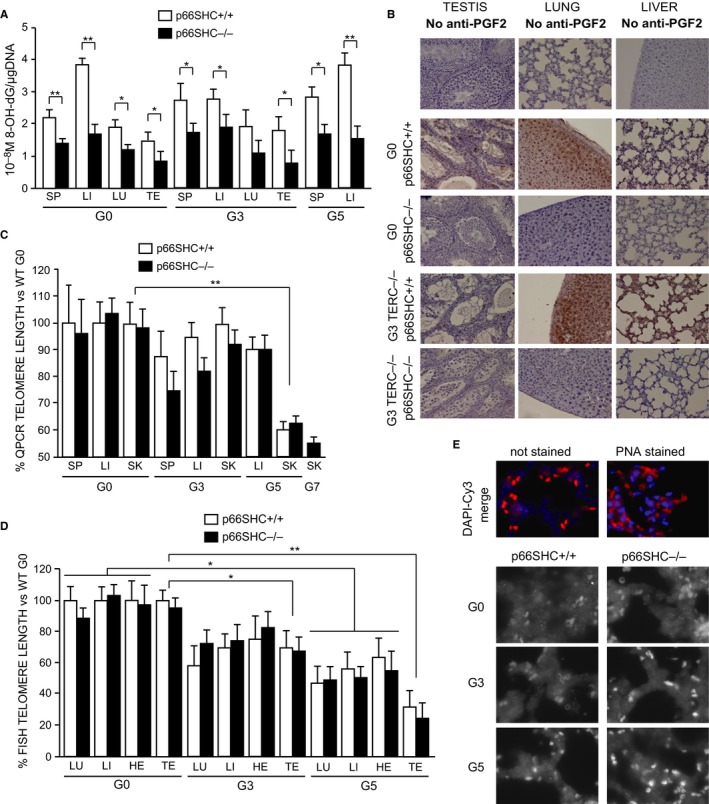
Oxidative stress and telomere length in TERC −/− p66SHC +/+ and TERC −/− p66SHC −/− mice. (A) Levels of 8‐OH‐dG per μg of DNA in TERC −/− p66SHC +/+ (white bars) and TERC −/− p66SHC −/− (black bars) spleen (SP), liver (LI), lung (LU), and testis (TE) measured by competitive enzyme immunoassay. Average values ±SD from n = 5 individuals for the G0 group and n = 3 individuals for the G3 and G5 groups are reported: * for P < 0.05 and ** for P < 0.01. (B) 8‐isoprostane IHC representative images of testis, lung, and liver from G0 and G3 TERC −/− p66SHC +/+ and TERC −/− p66SHC −/− mice. Level of background signal is shown in the first three unstained slices. (C and D) Telomere length (expressed as a percentage versus the telomere length of C57Bl/6J WT mice) in spleen (SP), liver (LI), lung (LU), heart (HE), testis (TE) and skin (SK) from TERC −/− p66SHC +/+ and TERC −/− p66SHC −/− mice of different generation as evaluated by qPCR (C) where the average values ±SD from n = 3 individuals per group, measured in quadruplicates, are reported or Q‐FISH (D) where the average values ±SD from n = 3 individuals per group, each sample evaluated from two different sections for a total of around 40 nuclei, are reported. * for P < 0.05, ** for P < 0.01. (E) Representative FISH images (Cy3 alone grayscale and DAPI‐Cy3 merged color) obtained from the lung of different generation TERC −/− p66SHC +/+ and TERC −/− p66SHC −/− mice.
