
Figure 3.
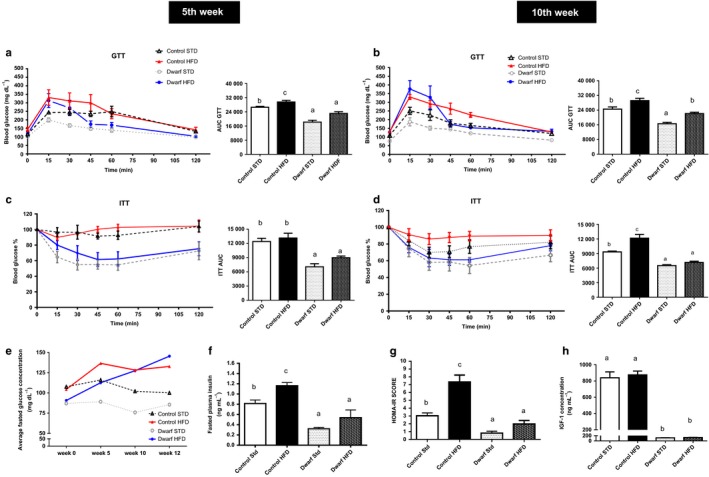
Long‐lived Ames dwarf mice are resistant to metabolic dysfunction induced by HDF diet. Ames dwarf and control mice consumed either STD or HFD diet for 12 weeks; GTT and ITT were performed during week 5 and week 10 of the study (n = 10 per group). (a) and (b) Glucose tolerance test (GTT) and area under the curve at 5 weeks and 10 weeks. Sixteen‐hour‐fasted mice underwent GTT by i.p. injection with 1 g glucose per kg of BW. (c) and (d) Insulin tolerance test (ITT) and area under the curve at 5 weeks and 10 weeks. Mice were injected i.p. with 1.0 IU porcine insulin per kg of BW. ITT data expressed as percentage of initial blood glucose concentration. (e) Average blood glucose levels. (f) Fasted insulin levels (g) HOMA‐IR Score (h) Circulating IGF‐1 levels. All values are presented as mean. The error bars represent the SEM. Groups that do not share a superscript are different with statistical significance (P < 0.05).