
Figure 4.
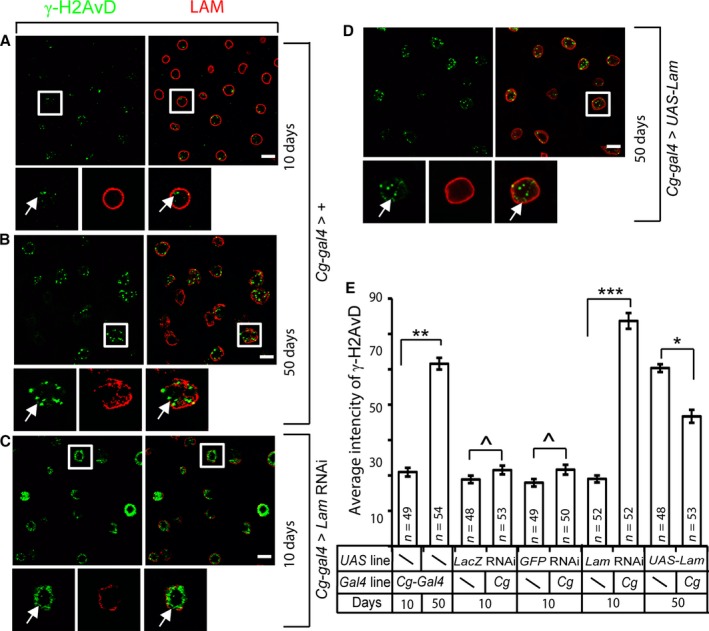
Age‐associated LAM loss may contribute to DNA damage in the fat bodies. (A–D) Compared to control young fat bodies (A, Cg‐gal4/+; tub‐gal80 ts /+), increase in γ‐H2AvD signal (green) in old fat bodies (B) could be mimicked by fat body‐specific depletion of LAM (red) in young flies (C, Cg‐gal4/+; tub‐gal80 ts /Lam RNAi), whereas forced expression of LAM in old fat bodies (D, Cg‐gal4/+; tub‐gal80 ts /UAS‐Lam) significantly reduced γ‐H2AvD signal. Nuclei boxed by white squares are enlarged to the bottom. Images were all taken from the A4 region. White arrows indicate γ‐H2AvD staining foci. Scale bars, 20 μm. (E) Quantification of γ‐H2AvD intensities in fat body cells from 10 or 50‐day‐old Gal4 control flies (Cg‐gal4/+; tub‐gal80 ts /+), UAS control flies (for Lam RNAi, LacZ RNAi, GFP RNAi, and UAS‐Lam), 10‐day‐old flies carrying Cg‐gal4/+;tub‐ gal80 ts /Lam RNAi, Cg‐gal4/ LacZ RNAi;tub‐gal80 ts /+, or Cg‐Gal4/+;tub‐gal80 ts /GFP RNAi, and 50‐day‐old flies carrying Cg‐Gal4/+;tub‐gal80 ts /UAS‐Lam. The γ‐H2AvD signal was determined by measuring the total nuclear immunofluorescence signal from the images captured using the same microscopy settings (see the detailed description in the experimental procedures). Nuclei from the A4 region (see Fig. 1A) were measured to allow the comparison among different fat bodies. Error bars, SEM. Student's t‐test: ^P > 0.5, *P < 0.5, **P < 0.01, ***<0.001. The numbers (n) of fat body cells analyzed shown were from three independent experiments.