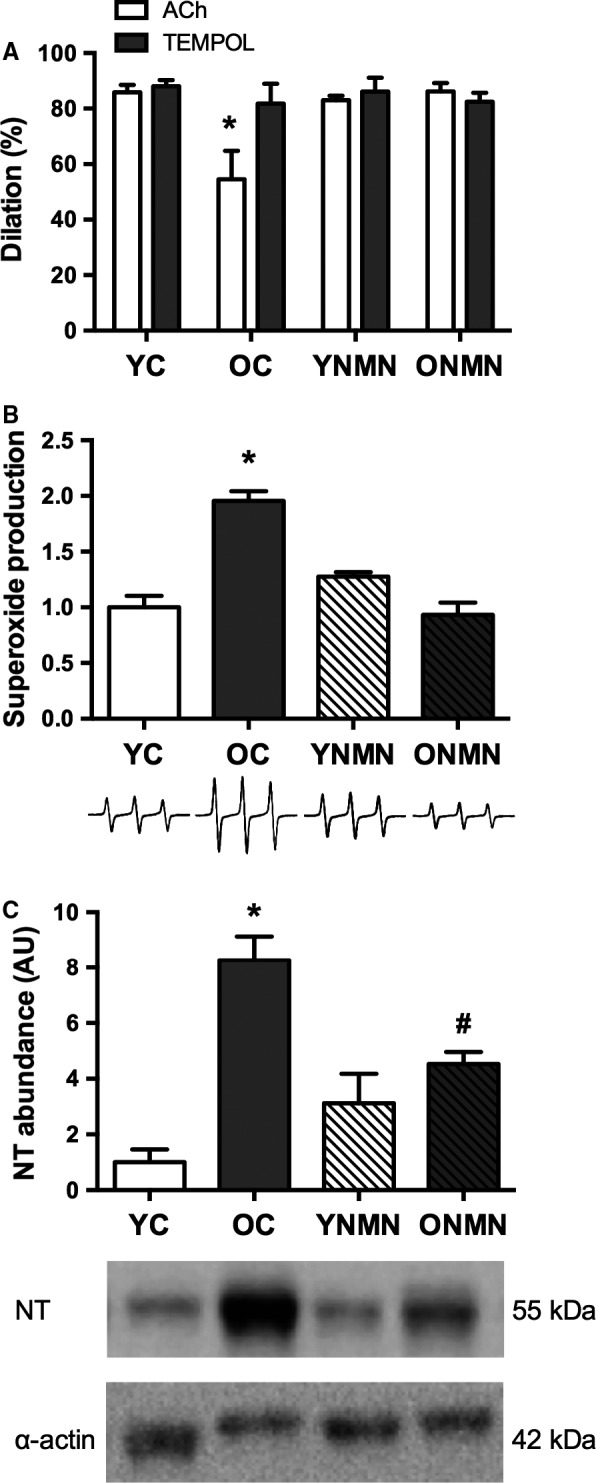
Figure 2.

Vascular oxidative stress. (A) Maximal dose–response to the endothelium‐dependent dilator acetylcholine (ACh) in young and old control (YC and OC) and young and old NMN‐supplemented (YNMN and ONMN) mice in the presence or absence of TEMPOL (n = 5–9 per group) *P < 0.05 vs. TEMPOL. (B) Superoxide production, assessed by electron paramagnetic resonance (EPR). Values are normalized to YC mean value. Representative EPR signal below (n = 4–9 per group). (C) Nitrotyrosine (NT) abundance in aorta. Data are expressed relative to α‐smooth muscle actin and normalized to YC mean value. Representative Western blot images below (n = 4–6 per group). Values are mean ± SEM. *P < 0.05 vs. all; # P < 0.05 vs. YC.
