Figure 3.

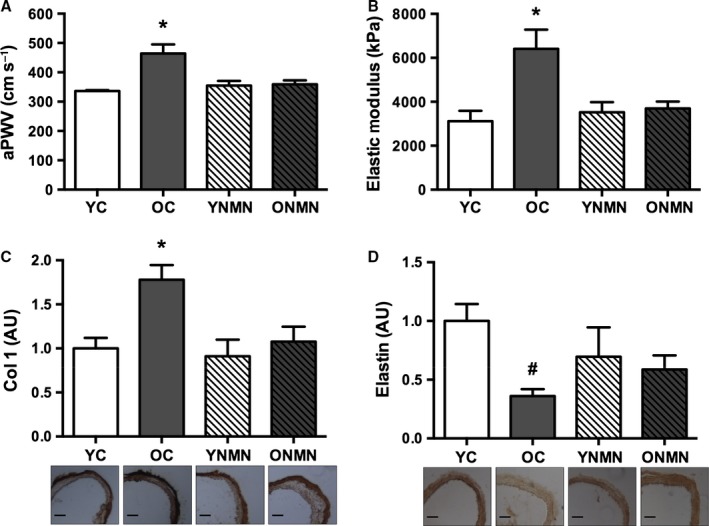
Large elastic artery stiffness. (A) Aortic pulse wave velocity (aPWV) in young and old control (YC and OC) and young and old NMN‐supplemented (YNMN and ONMN) mice (n = 5–9 per group). (B) Elastic modulus (n = 5–6 per group). (C) Total collagen 1 (Col 1) expression in aorta (n = 4–9 per group). (D) Total elastin expression in aorta. Values normalized to YC mean value. Representative images below (n = 4–11 per group). Values are mean ± SEM. Bars = 100 μm. *P < 0.05 vs. all; # P < 0.05 vs. YC.
