
Figure 1.
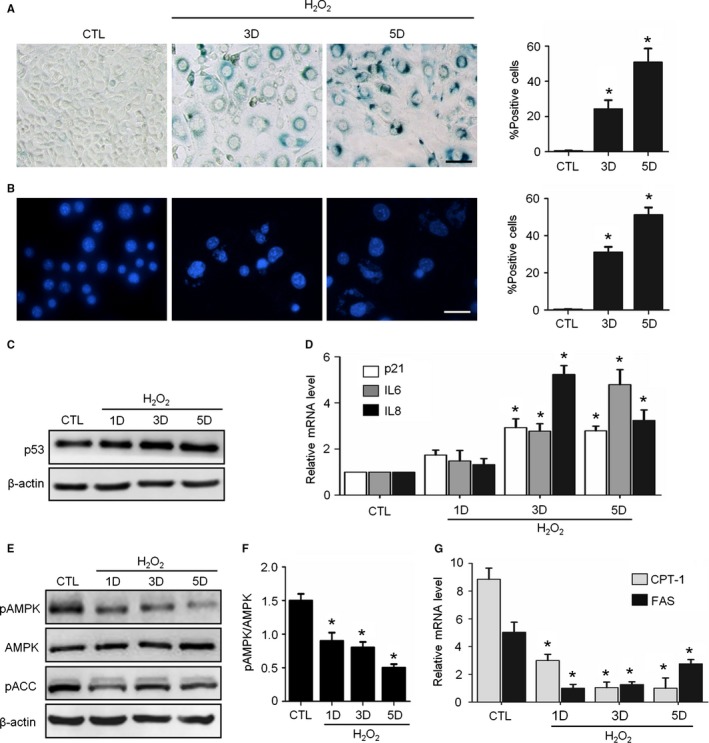
H2O2 induced senescence and AMPK pathway inhibition in NIH3T3 Cells. Cells were treated with H2O2 and incubated in complete medium without H2O2 for 3‐5 days. CTL means untreated cells. (A) Representative images of SA‐β‐Gal staining of the cells (left) and percentages of SA‐β‐Gal‐positive cells in a total of 1000 cells (right). (B) Representative images of SAHFs in cells (left) and percentages of SAHFs‐positive cells in 1000 cells (right). (C) Representative images from immunoblot assays against p53 and β‐actin. (D) Relative fold‐changes in the mRNA levels of the genes encoding p21, IL6 and IL8, as determined by qRT‐PCR. (E) Representative images from immunoblot assays against phosphorylated AMPKα (pAMPK, Thr172), AMPKα1, phosphorylated ACC (pACC, Ser79), and β‐actin. (F) The ratio of pAMPK to total AMPK was quantified by densitometry based on immunoblot images from three independent experiments. (G) Relative fold‐changes in the mRNA levels of two AMPK target genes (CPT‐1 and FAS) were monitored by qRT‐PCR assays. *P < 0.05 compared to the control (CTL). The bar represents 100 μm.