
Figure 2.
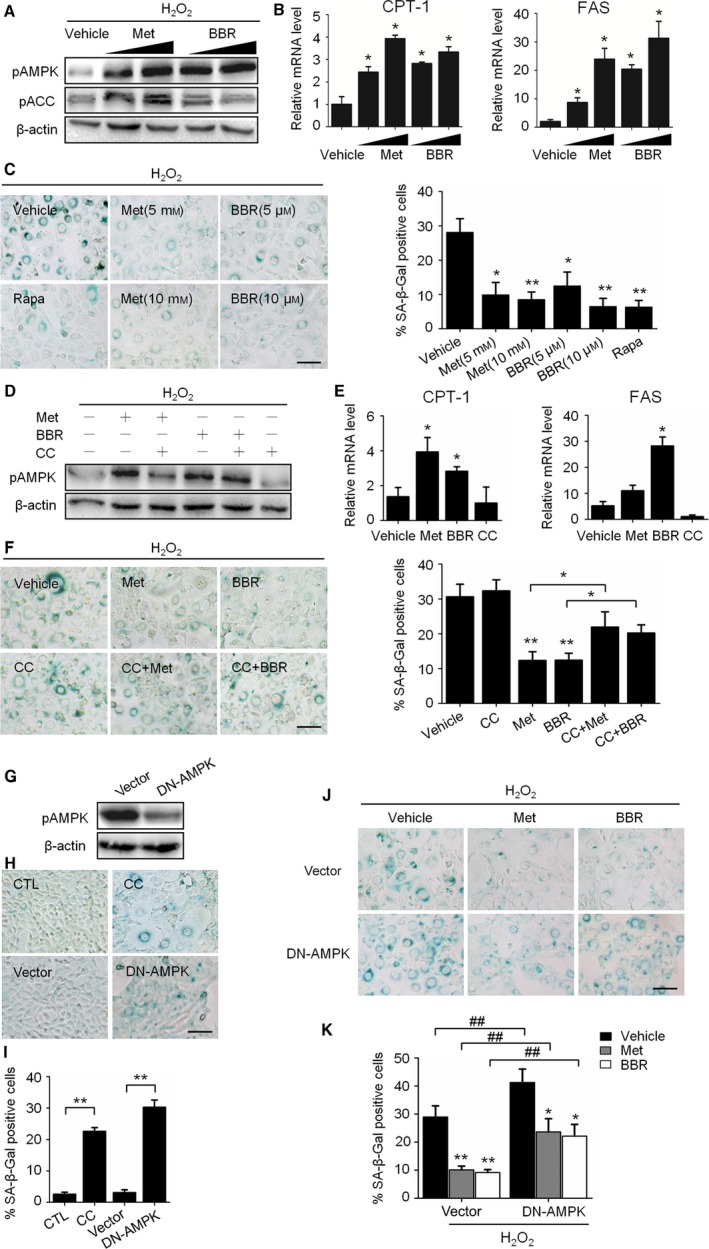
Activation of AMPK prevented H2O2‐induced senescence. A to D: H2O2‐treated NIH3T3 cells were incubated in complete medium with metformin (Met, 5 to 10 mM) or berberine (BBR, 5 to 10 μM) for 3 days. (A) Representative images from immunoblot assays against pAMPKα (Thr172), AMPKα1, pACC (Ser79), and β‐actin. (B) Relative fold‐changes in mRNA levels of CPT‐1 and FAS as determined by qRT‐PCR. (C) Representative images of SA‐β‐Gal staining of cells (left), and percentages of SA‐β‐Gal‐positive cells. D‐F: NIH3T3 cells were treated with H2O2 and incubated with Met (10 mM), BBR (10 μM) and an AMPK inhibitor, Compound C (CC, 10 μM), alone or in combination for 3 days. (D) Representative images from immunoblot assays. (E) Relative mRNA levels of CPT‐1 and FAS as determined by qRT‐PCR. (F) Representative images of SA‐β‐Gal staining of cells (left) and percentages of SA‐β‐Gal‐positive cells (right). G‐I: NIH3T3 cells without H2O2 treatment were used. (G) The decrease in AMPK activity in DN‐AMPK‐expressing NIH3T3 cells was shown by the decrease in AMPKα phosphorylation. (H) Representative images of SA‐β‐Gal staining of the nontransfected cells with or without CC (upper) and cells transfection with DN‐AMPK (lower). (I) The percentages of SA‐β‐Gal‐positive cells were calculated based on the images represented in H. (J) H2O2‐treated cells incubated with or without Met (10 mM) or BBR (10 μM) for 3 days, representative images of SA‐β‐Gal staining of cells transfected with empty vector (upper) or DN‐AMPK (lower). (K) The percentages of SA‐β‐Gal‐positive cells were calculated based on the images presented in J. *P < 0.05 and **P < 0.01 compared to the vehicle control or indicated sample, ## P < 0.01 compared to the indicated sample. The bar represents 100 μm.