
Figure 3.
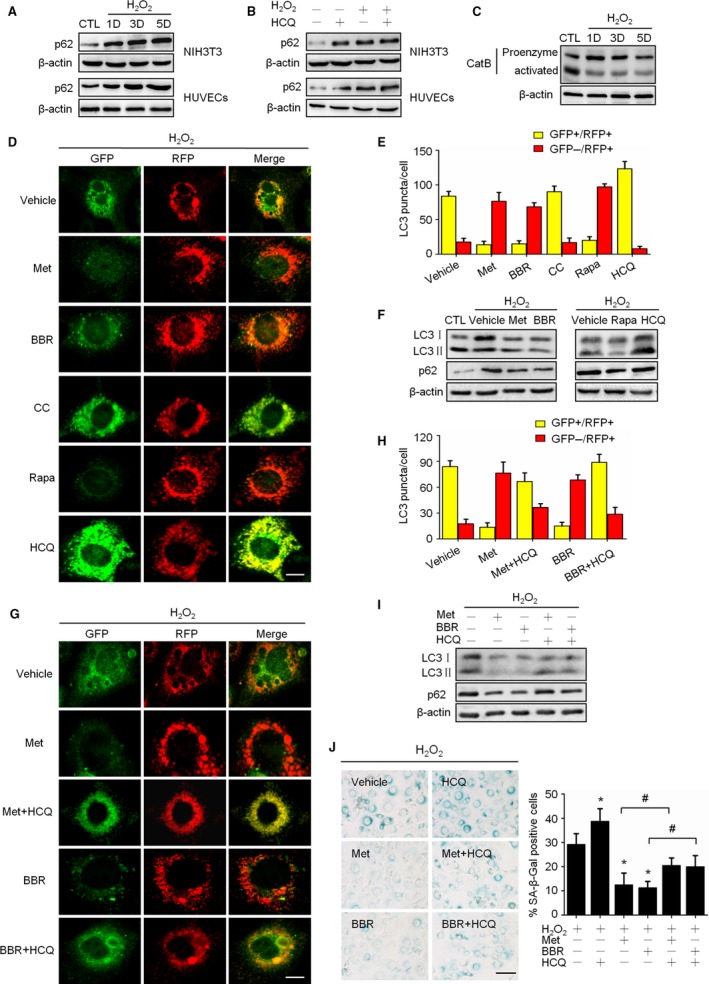
Activation of AMPK improved autophagic flux impaired by H2O2 treatment. (A) Cells were treated as Fig. 1, representative images from immunoblot assays against p62 and β‐actin. (B) Control and H2O2‐treated cells were incubated with solvent or hydroxychloroquine (HCQ, 2 μM) for 3 days; representative images from immunoblot assays against p62 and β‐actin. (C) Representative images from immunoblot assays against Cathepsin B protein. D to G: GFP‐RFP‐LC3‐expressing cells were treated with H2O2 then incubated for 3 days with different reagents including: Met (10 mM), BBR (10 μM), CC (10 μM), Rapa (50 nM), and HCQ (2 μM). (D) Representative confocal fluorescent images of RFP‐GFP‐LC3‐expressing cells, and the right panel shows the merged fluorescence. The bar represents 20 μm. (E) Percentages of cells with puncta like LC3 were figured up based on the images represented in D, dividing into GFP+/RFP+ group (yellow column) and GFP‐/RFP+ group (red column). (F) Representative images from immunoblot assays against LC3 and p62 proteins. (G) GFP‐RFP‐LC3‐expressing cells were incubated with indicated reagents alone or in combination for 3 days; representative confocal fluorescent images are shown as described in D. The bar represents 20 μm. (H) Percentages of cells with punctalike LC3 were figured up and grouped as described in E. (I) Representative images from immunoblot assays against LC3 and p62 proteins. (J) Representative images of SA‐β‐Gal staining of cells (left) and the percentages of SA‐β‐Gal‐positive cells (right). The bar represents 100 μm.*P < 0.05 compared to the vehicle control, # P < 0.05 compared to the indicated sample.