
Figure 5.
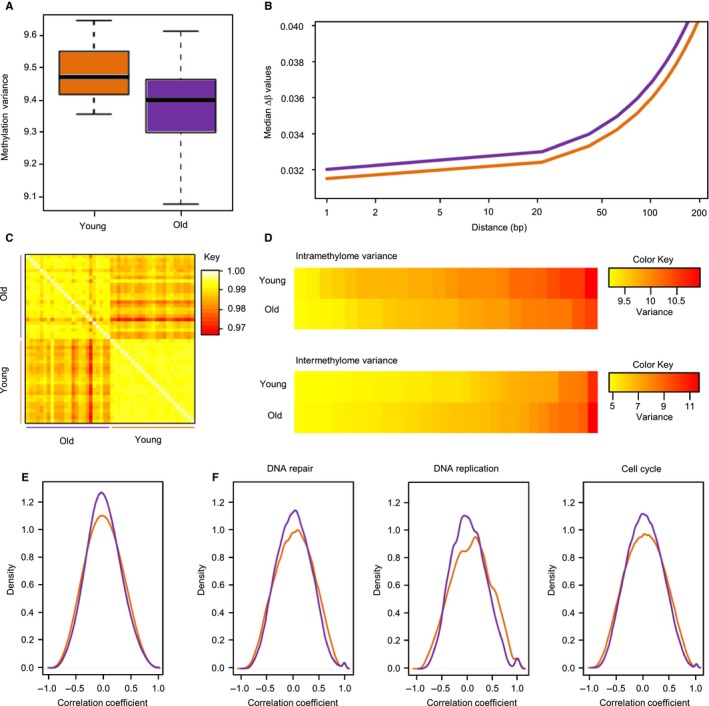
Erosion of methylation patterns in old samples. (A) Intramethylome variance for young and old samples. (B) Spatial correlation of methylation marks. Lines indicate smoothened medians of distance‐dependent β value differences for the young (orange) and old (purple) datasets. (C) Methylation heterogeneity analysis. Pearson correlation coefficients were calculated after performing a probe‐by‐probe β value comparison for all young and old samples. (D) Heatmaps of intramethylome and intermethylome variance. For the intermethylome variance, results are shown for the 30 most variable probes. (E) Global pairwise correlation of gene expression data from young (orange) and old (purple) samples. The plot represents the overall density distribution of the correlation coefficient of genes. (F) Correlation density plots for specific pathways from the Reactome database. Young and old samples are shown in orange and purple, respectively.